|
FROM DIRECTIONAL SATELLITE MEASUREMENTS Sylvain G. LEBLANC1, Jing M. CHEN2, H. Peter WHITE1, Josef CIHLAR1, Roselyne LACAZE3, Jean-Louis ROUJEAN3, and Rasim LATIFOVIC1. 1Canada Centre for Remote Sensing
2Department of Geography,
3Centre Nationale de Recherches Météorologiques
|
|||||||||
| ABSTRACT- Leaf area index (LAI) retrieval techniques from satellite imagery have been much improved in recent years, and LAI maps can now be routinely made (Chen et al., 2000a). But the separation of the sunlit from shaded LAI, which has direct implications for photosynthesis (Chen et al., 2000b), has not yet been achieved with remote sensing imagery. When using LAI in carbon models, some generic assumptions about the foliage clumping derived from in-situ measurements are therefore used. The in-situ clumping can be measured through destructive sampling and gap fraction estimates or with instruments such as TRAC (Chen, 1996). However, the estimation of such a quantity from remote sensing images is complex. Previous studies by Chen et al. (1999) and Lacaze (1999) based on spaceborne POLDER data and generic ranges of clumping index for different species showed that the clumping is related to the shape of the bidirectional reflectance distribution function (BRDF). This is expressed through anisotropy indices, based on the reflectance at the hotspot (where the sun and view angles coincide) and the darkspot (where the reflectance is at its minimum). In the present study, the canopy radiative transfer model Five-Scale (Leblanc and Chen, 2000) is used to study the relationship between the foliage clumping (and other canopy structural parameters) and different indices based on directional remote sensing measurements. The study examines the effects of foliage distribution on the relationship for different crown shapes and sizes, spatial distribution of stems, and LAI variation (1 to 8). The results show that the indices, based on the hotspot and darkspot reflectance, are generally related to the total clumping. The Normalised Difference of Hotspot and Darkspot (NDHD) in the near infrared band is more linearly related to the clumping index. Using POLDER data from ADEOS-1, interpolated by the kernel-based Four-Scale Linear Model for AnIsotropic Reflectance (FLAIR) (White et al., 2000), a map of clumping index over Canada is produced from the relationship found with Five-Scale. A methodology to validate continental and global clumping index maps using directional remote sensing images at different scales is proposed based on the strategy used in the Canadian LAI validation project (Chen et al., 2000a). | |||||||||
|
|
|||||||||
| 1-INTRODUCTION
The retrieval of biophysical parameters from remote sensing data is
an ongoing activity that has shown great potential. One important parameter
that has been retrieved and validated is the leaf area index (Chen et al.,
2000a). LAI defines the area that interacts with solar radiation and is
responsible for carbon absorption and exchange with the atmosphere. In
the retrieval of LAI from nadir view imagery, the distribution of the foliage
is not considered separately from the LAI. The production of maps that
can describe how the foliage is distributed within a pixel is of high importance
in the estimation of carbon exchange between vegetation and the atmosphere
(Chen et al., 1999, Chen et al., 2000b). A clumping index (Nilson, 1971),
has been used to describe the deviation of foliage distribution from the
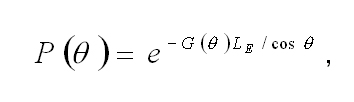
random distribution based on a Poisson model. A random foliage distribution
gives a probability of the gap fraction related to LAI at a view angle
q
as:
|
|||||||||
 (1)
(1) |
|||||||||
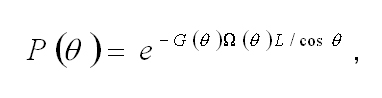
| where G(q) is the projection coefficient; and LE is the effective LAI which is the LAI found assuming a random foliage distribution. When clumping is introduced, eq. (1) becomes: | |||||||||
 (2)
(2) |
|||||||||
| where W is the clumping index and L the LAI. When W increases, the foliage is less clumped: e.g., W = 1 means random foliage distribution and W< 1 means clumped foliage. As one important goal of the clumping index is to estimate the amount of shaded and sunlit leaves, we focus our attention on W(q) at q equal to the solar zenith angle (qs). The sunlit LAI (Ls) can be easily calculated by using the complement of (2) at the solar zenith angle and projecting it to the ground (Kucharik, 1997) | |||||||||
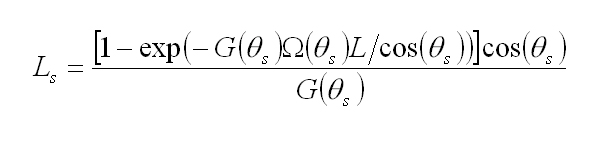 (3) (3) |
|||||||||
| Without the information about the clumping, the sunlit LAI error can
vary greatly. For a LAI of 4, assuming a random foliage distribution (G(qs)
=0.5), with a solar zenith angle of 45 degrees, a typical conifer forest
with clumping index of 0.5 would overestimate the sunlit LAI by 24%. Studies
of canopy photosynthesis estimation showed a 30% difference (Chen et al.,
1999) when the clumping information was not used.
Clumping in coniferous species is generally separated into two categories;
the first one is the clumping at the shoot level (gE)
and the second is the clumping at levels higher than the shoot (WE):
|
|||||||||
|
W = WE/gE
(4)
|
|||||||||
| The clumping at levels higher than the shoot is also dividable into sub-categories: clumping at the foliage-branch or whorl level (inside crowns), at the crown level, and non-random distribution of crowns. The clumping has been found to be dependant on the view zenith angle (Kucharik et al., 1997), but that angular dependence has been shown to follow some patterns that allows it to be estimated from only one angular measurement of clumping with instrument like TRAC (Chen, 1996) or MVI (Kucharik et al., 1997). | |||||||||
| Chen et al (2000a) retrieved the leaf area index L = LE ??? from AVHRR,
LANDSAT and SPOT VGT imageries. Care must be taken when using this LAI
in models since ? is angle dependent and both LE and L are angle independent.
Equation (3) generally uses a generic clumping index based on in-situ measurements
to get the sunlit foliage.
Previous studies (Chen et al., 1999, Lacaze, 1999) have shown that directional
reflectance has the potential to estimate a clumping index from POLDER
data hotspot and darkspot difference normalised by the darkspot (HDS).
Sensors like ADEOS-POLDER and TERRA-MISR are especially well suited for
this kind of research since they can acquire multiple view angles of the
same ground position on one orbit. POLDER is best used at the global scale
because of its 6 ? 7 km nadir resolution and high angular resolution while
MISR can be used at both global and at a regional scale with its 275 m
resolution. For MISR, a fit between an index based on the darkspot and
hotspot and ground clumping index measurements can be found since the moderate
pixel size can be covered by ground plots. This relationship can then be
applied to the whole image. For space-borne POLDER data, relationship found
from another source, e.g. a model or fits found between MISR or airborne
directional must be used since the clumping of a pixel of several kilometres
is impossible to measure in-situ. Because sensors do not always measure
the hotspot and darkspot values, the use of kernel models is essential.
These models are also used to simulate the reflectances at a common solar
zenith angle for all pixels that were taken at different solar zenith angles.
|
|||||||||
| 2. HOTSPOT AND DARKSPOT
It is important to understand the physical reasons why hotspot and darkspot
reflectances can yield information about the foliage clumping. Most of
the clumping information resides in the darkspot, the hotspot being more
important in removing species dependency coming from different optical
properties of the foliage. The hotspot is the phenomenon that arises when
the view and sun angles coincide. The viewers then see only sunlit foliage
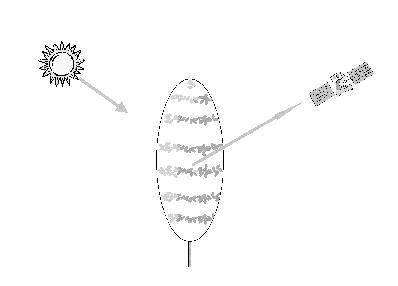
and background, which results in very large reflectance. Figure 1
shows a schematic view of what is measured in the forward scattering direction
in the case of a tree crown when no mutual shadows are present. The major
contribution that the sensor receives from the crown comes from the sunlit
foliage seen through the crown. When the density increases in the crown,
the sunlit foliage becomes more difficult to see from the forward scattering
side, as the crowns become more and more opaque. The effect of increasing
the foliage and fixing the number of stems and size of crowns is to augment
the clumping as more and more foliage is found in the same space. At the
crown scale, when more crowns are clustered together, mutual shadowing
must be considered. The effect of mutual shadowing on the forward scattering
is also to diminish the reflectance. Lower forward scattering reflectance
is then associated with higher clumping. For a single species, the
forward scattering reflectance could probably be used alone to retrieve
the clumping, but this relationship would be dependent on the foliage optical
properties. Using the hotspot or the darkspot for normalisation removes
the optical effect from the foliage and from the background. Clumping in
branches may have different effects depending on the branch and foliage
inclination compared to view and solar zenith angles. If the branches are
close to horizontal., having the foliage clumped near the branches could
increase the amount of sunlit foliage seen and increase the reflectance.
The study of the branch architecture effects on the clumping and its retrieval
is not the focus of the present paper. The foliage distribution angle is
assumed to be random in all simulations presented here.
|
|||||||||
 |
|||||||||
| 3-FIVE-SCALE SIMULATIONS
Since ground measurements and fine resolution directional reflectance
are not measured at the same site in great numbers, it is difficult to
assess directly the anisotropy due to foliage clumping. The Five-Scale
radiative transfer model (Chen and Leblanc,
1997; Leblanc and Chen, 2000) is used to achieve this assessment. Five-Scale
is well suited for this research since it was develop to consider the interaction
of solar radiation with foliage by considering many levels of foliage clumping:
1) non-random distribution of crowns; 2) foliage clumped in crowns; 3)
foliage clumped in branches; and 4) foliage clumped in shoots. A new geometry-based
multiple scattering scheme is now implemented in Five-Scale allowing a
wider range of simulations (Chen and Leblanc, 2000). It is used here to
simulate the hotspot and find the darkspot of the BRDF of a large range
of foliage distribution patterns in different plant canopies. Table 1 shows
the different indices that are compared with the foliage clumping and other
forest parameters. The clumping of foliage can be obtained in different
ways since it is a statistic deviation that should be independent of the
LAI. Five-Scale does not have the total clumping as an input parameters,
so many combination of architectural parameters and LAI are used to simulate
a large range of clumping index.
|
|||||||||
|
|||||||||
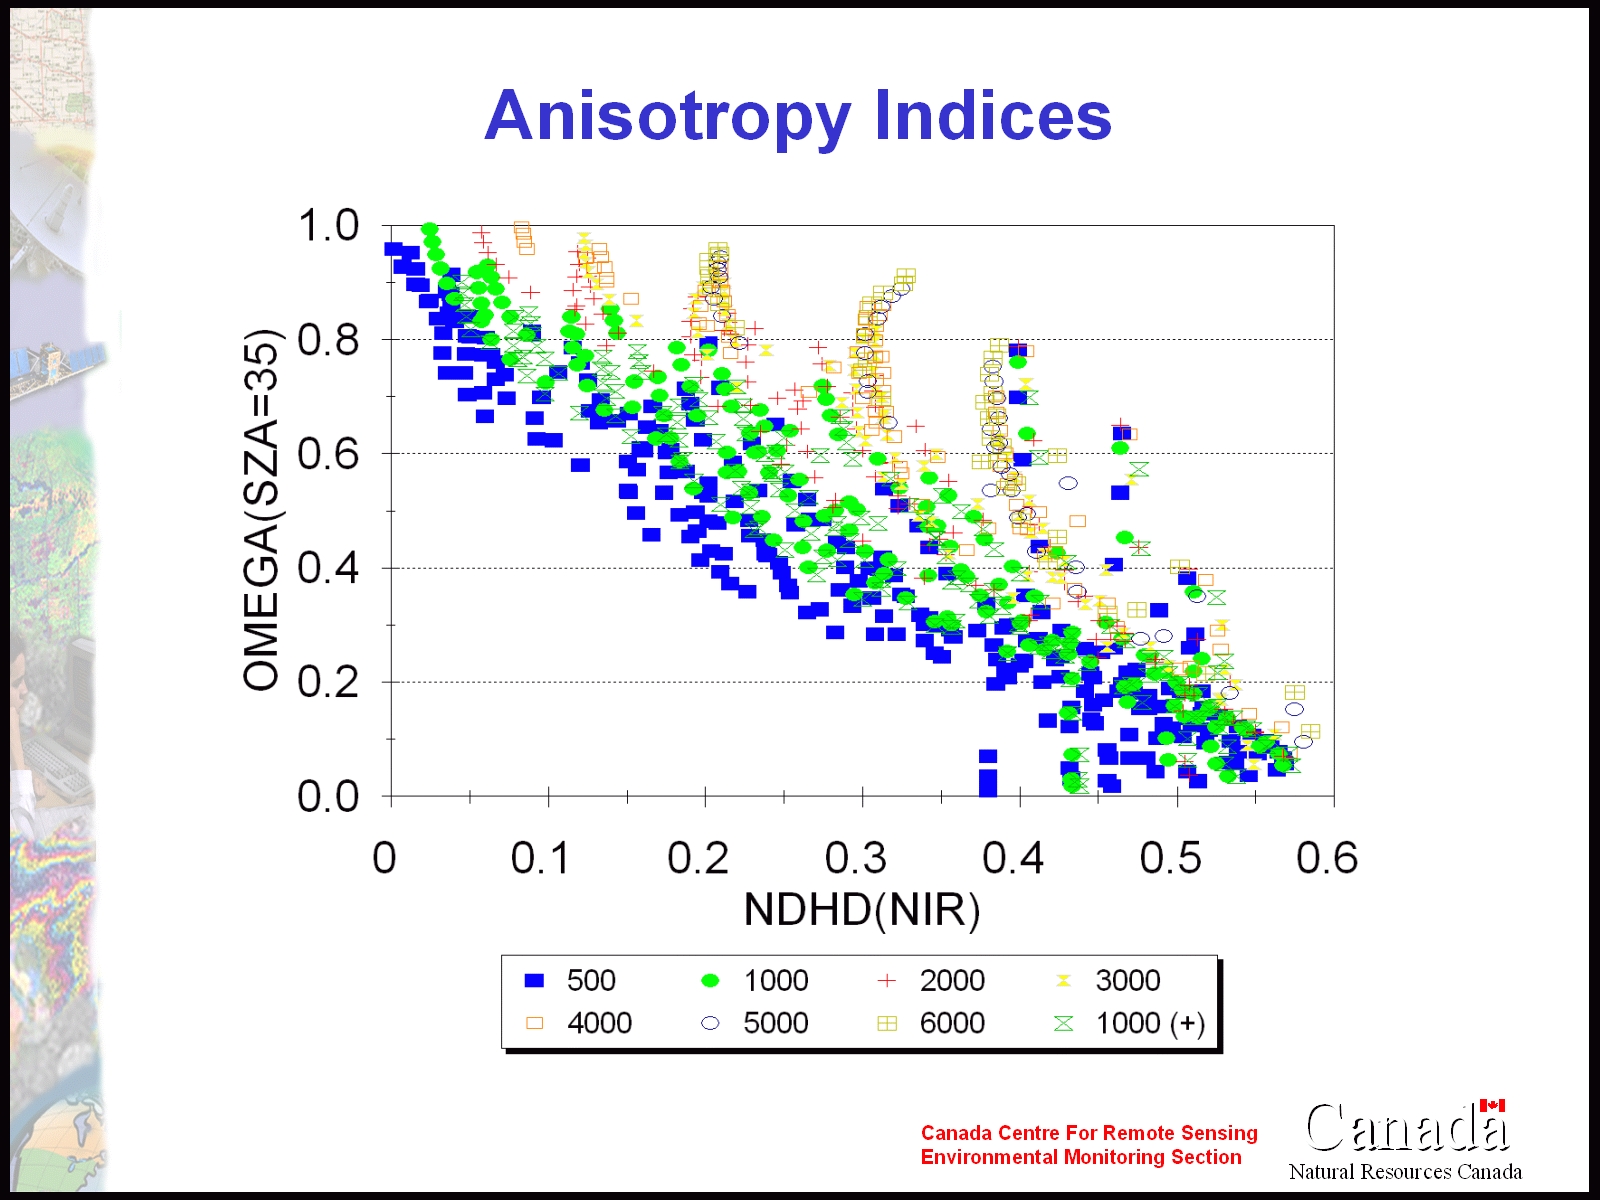
Fig. 2: Clumping index (Omega) at the scale greater than the shoots as a function of the anisotropy index NDHD, based on Five-Scale simulations. Each symbol represents a different number of stems per hectare. 1000(+) indicates the use of a grouping of crowns using the Neyman distribution with a tree grouping factor of 5. NOTE: see original paper in Proceeding for other figures |
|||||||||
| The ranges of parameters used in this study are:
LAI: 1-8 m2/m2
These factors influence the clumping at the crown scale and larger scales.
The clumping inside the crown, at the shoot level, is also investigated
over a subset of the large simulation. The simulations were done with deciduous
parameters from aspen species in Fig. 2. Only physically possible combinations
of parameters are kept based on crown cover and foliage density.
The three indices were used in the red (670 nm) and near infrared (865
nm) band equivalent of POLDER. The results from NDHD in the near infrared
gave the best linear fit between NDHD and the clumping index, especially
for simulation with 500 to 2000 stems per hectare (see Fig. 2). A linear
relationship is preferred since it allows linear mixture of foliage clumping
within pixels to be considered. The simulations of canopies with 4000 and
more trees per hectare seems to have a different behaviour that is not
as linear as for lower densities. This is due in part of the overlap of
crowns and will need to be investigated more closely.
|
|||||||||
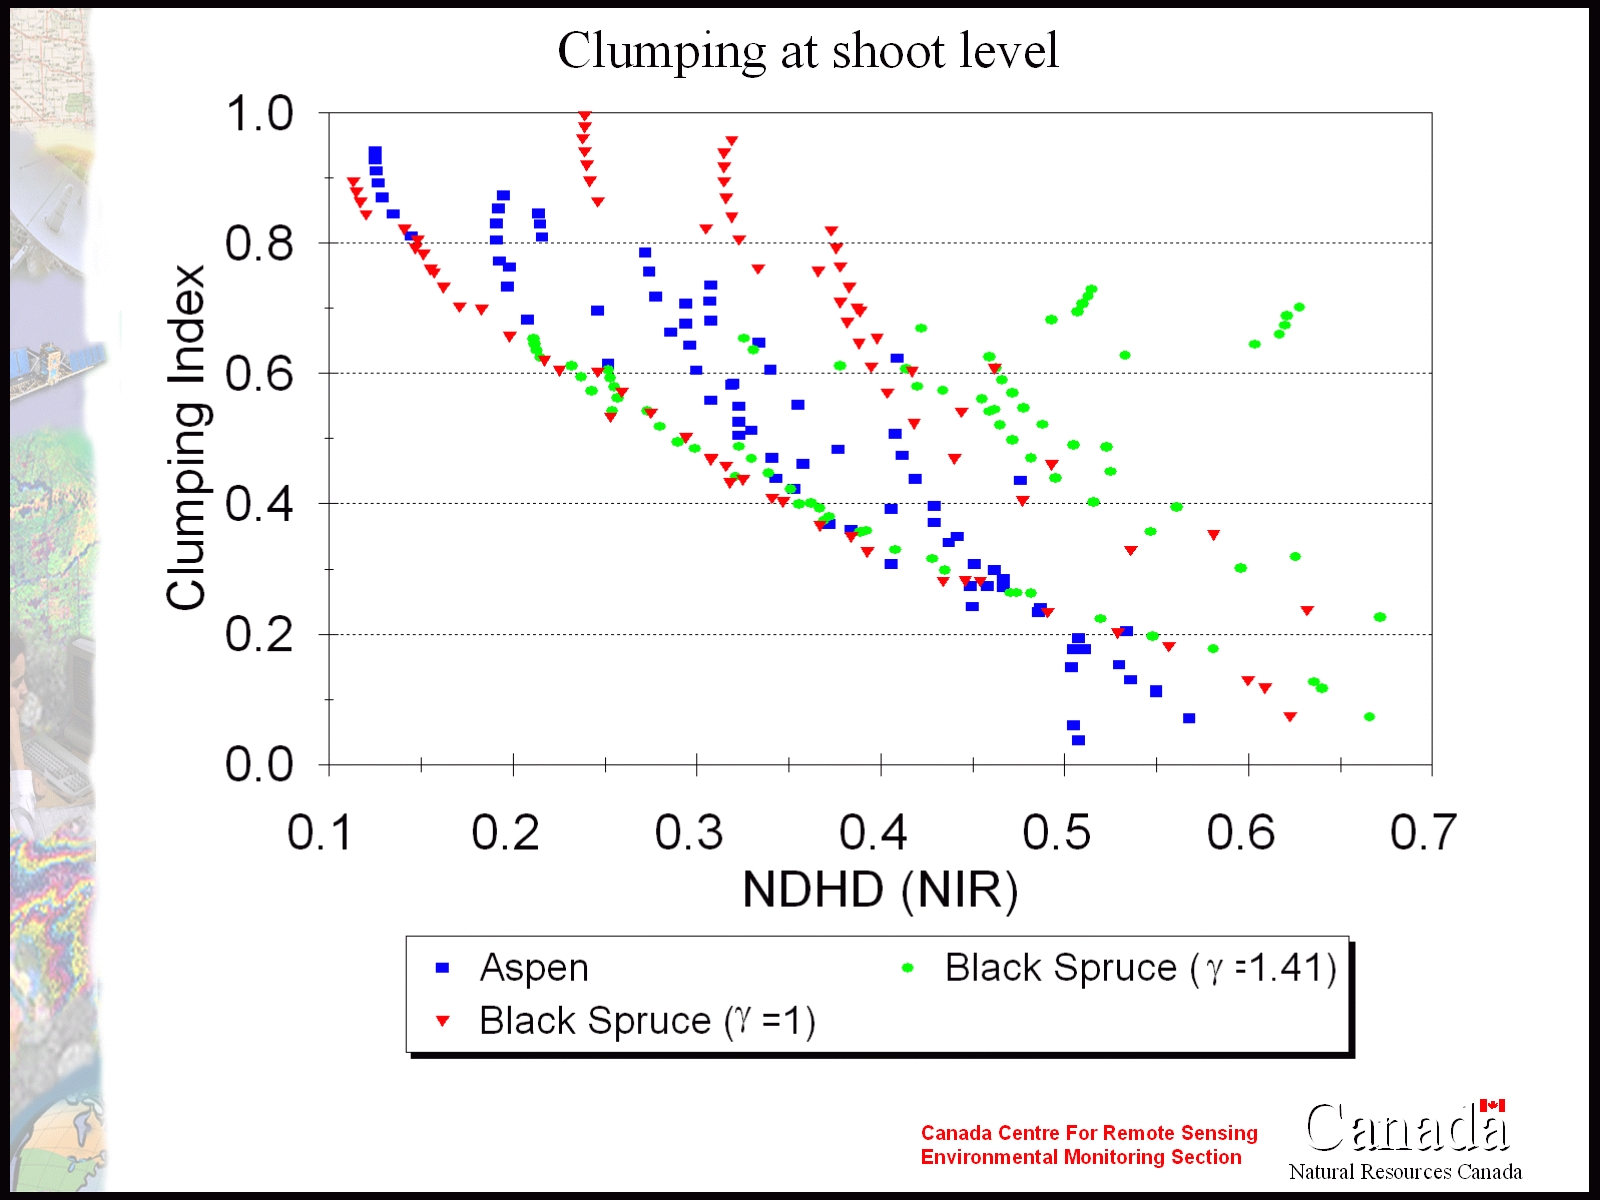
Fig. 3: Aspen simulation with 2000 stems per hectare compared to simulation of black spruce canopies with and without clumping at the shoot level. |
|||||||||
| Some of these simulations are at the limit of both physical reality
and calculation capability of the model and may not be found in nature,
but they had to be included in the fit in order to consider as many different
ways as possible to obtain the same clumping index values.
The linear fit between NDHD and the clumping index calculated at the
solar zenith angle (35 degrees) gave a coefficient of determination R2
of 0.67 with 759 simulated principal solar planes:
|
|||||||||
| Fig. 3 shows how the clumping at the shoot level influences the NDHD.
It is clear that the clumping at the shoot level gives a different output
than clumping at other levels. The conifer simulation with no shoot clumping
resembles the clumping value for the deciduous species, indicating that
the clumping of needles into shoots may not be measurable from remote sensing.
It must be noted that since the aspen crowns were simulated with a spheroid
and the black spruce crowns with a cone on top of a cylinder, the clumping
due to the crown shapes, which defines a different volume where the foliage
is found, may explain the shift of the black spruce points when no needle
to shoot clumping is included.
A test was made to see if the search for the lowest reflectance, the
darkspot, was necessary. Fig.4 shows that the NDHD based on the darkspot
at a fixed view angle (in this case 45 degrees) is highly correlated to
the "darkest" reflectance, although this may induce a non-linearity between
the clumping and the NDHD index for low values of NDHD. A reflectance from
a fixed view angle would accelerate the process of calculating an anisotropy
index. Since the Five-Scale did show a better correlation with the actual
darkest reflectance, the NDHD used for mapping clumping in this paper is
not based on a fixed view zenith angle darkspot reflectance. Tests were
also made to check the influence of other parameters on the NDHD.
|
|||||||||
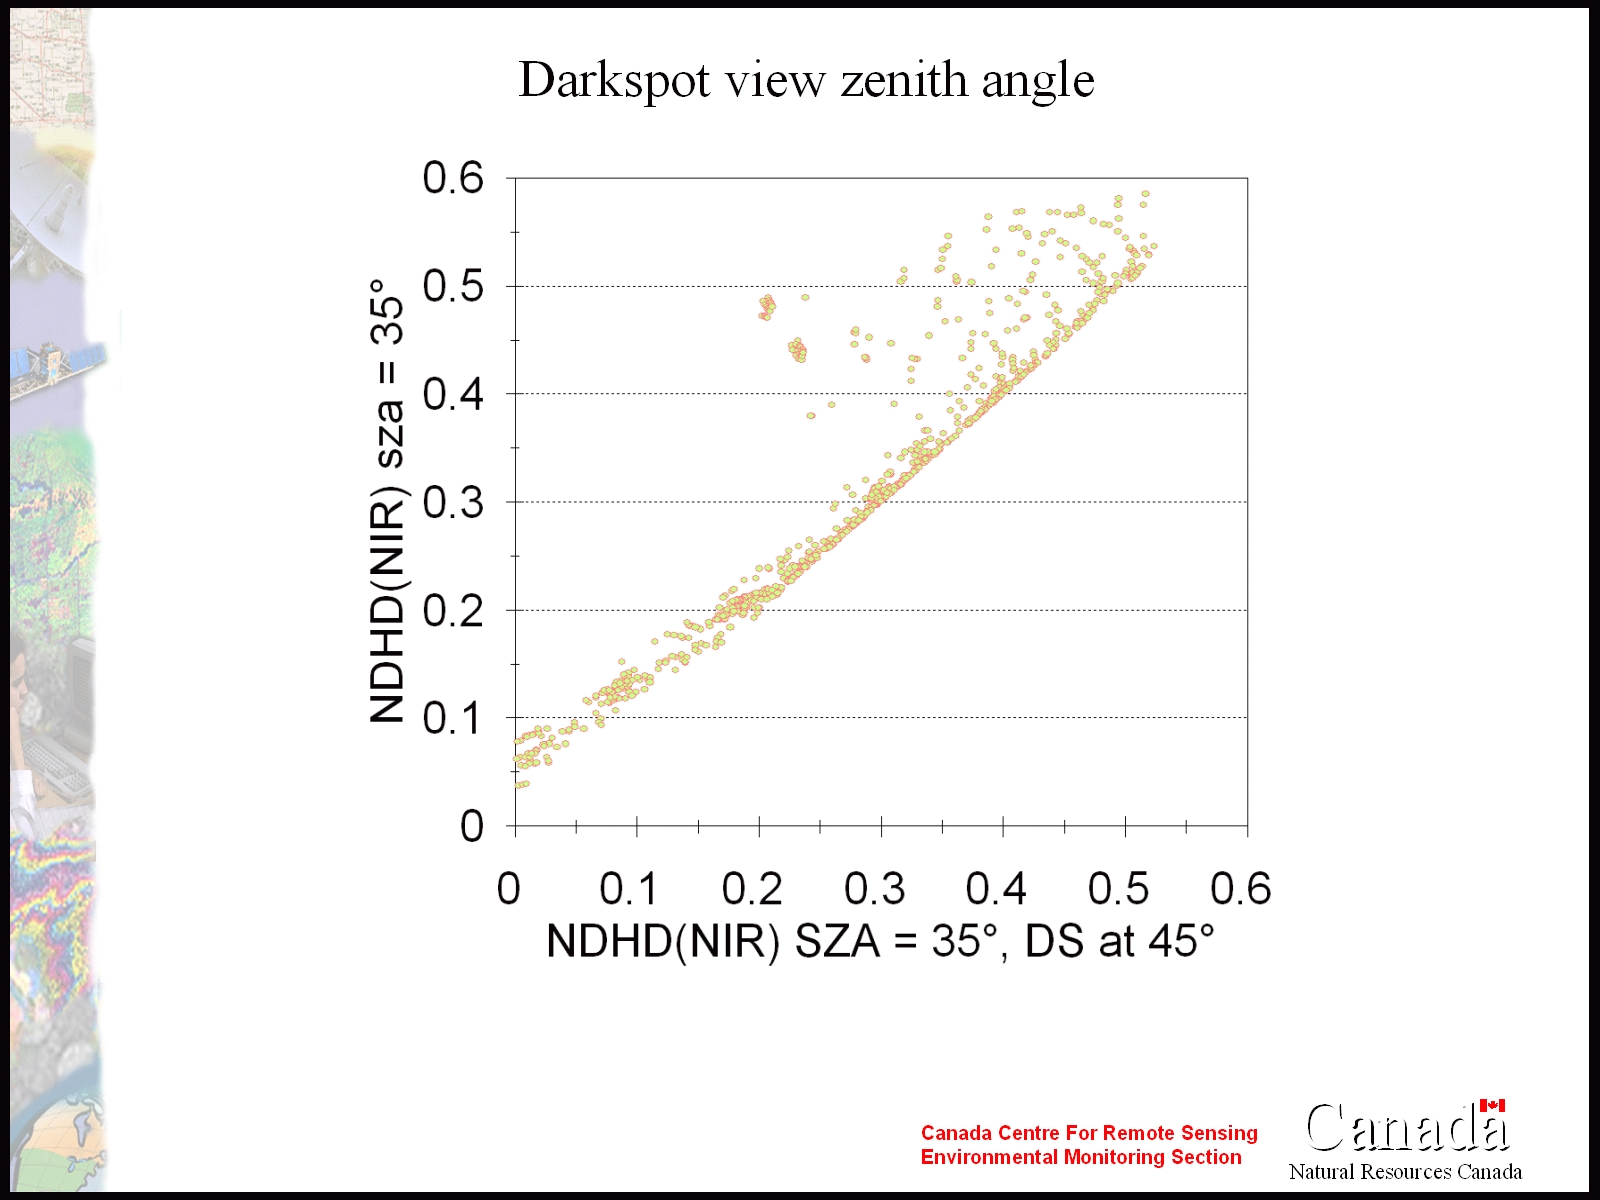
Fig. 4: Comparison of NDHD using the flexible darkspot and that using darkspot at 45? view zenith angle in the forward scattering direction. |
|||||||||
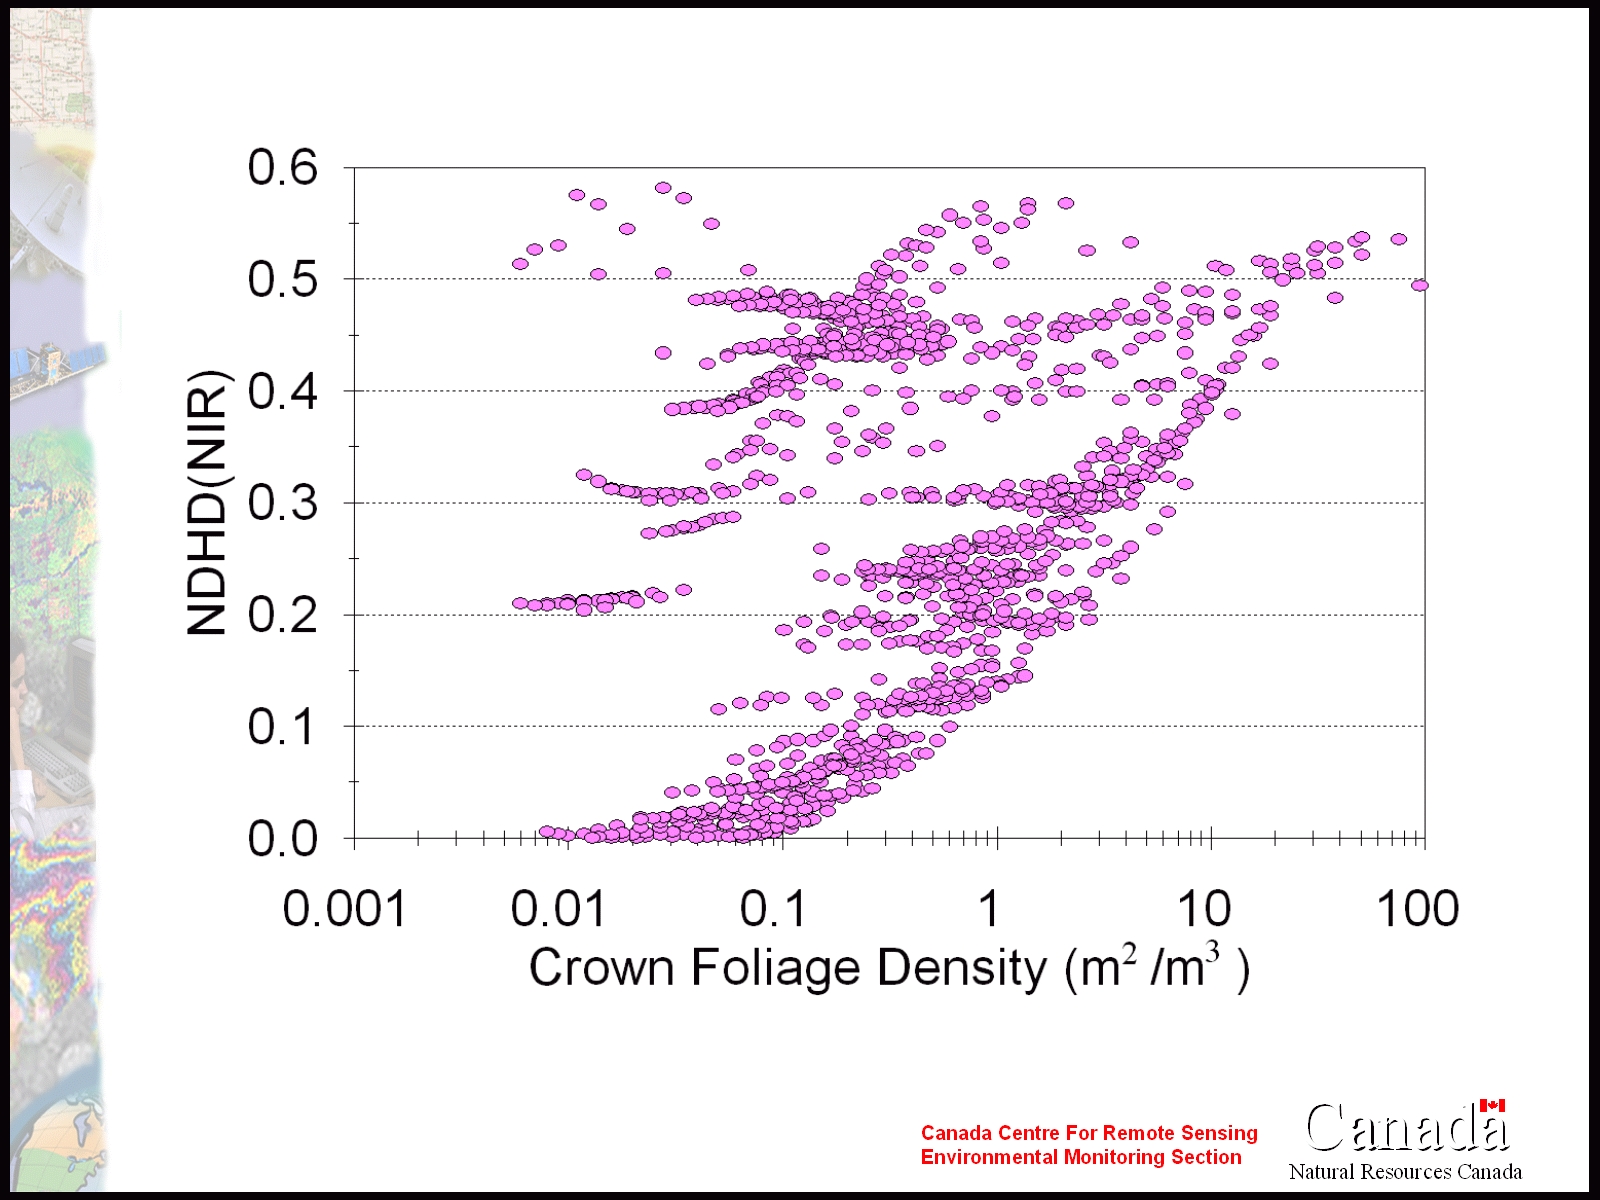
Fig. 5: a) Influence of LAI and b) influence of crown foliage density on NDHD as simulated by Five-Scale. |
|||||||||
| Fig. 5 shows how the LAI influences the NDHD. LAI of 1, 2, 5 and 8 were used and demonstrate that generally, the LAI and NDHD are independent. This is expected as the LAI and clumping are two distinct biophysical parameters and should be independent. The fact that the NDHD seems to increase with larger LAI may just be an artifact of the simulations used. The same crown size variation and stem densities were used in all LAI values. When more foliage is found in the same volume, it is then more clumped, hence the higher NDHD. It also means that the range of input parameters did not produce a random distribution of foliage for large LAI because not all the physical cases have been simulated. It is expected that as more cases are added that the independence of NDHD with LAI will be clearer. The crown foliage density was also compared to NDHD and shows that although some links seems to exist between the density and NDHD, this is not as strong as the relationship between clumping index and NDHD. This indicates that NDHD in the near infrared band is a good indicator of the overall foliage clumping in a canopy. | |||||||||
| 4- CLUMPING INDEX MAPPING
Directional POLDER data taken over Canada at the end of June 1997 are
used to calculate the anisotropy index NDHD and map the derived clumping
index. Since the nadir footprint of the POLDER data is about 6 ? 7 km,
a landcover map of Canada (Cihlar et al., 1999) based on NOAA-14 AVHRR
data is used to find 7 by 7 km area with a covertype covering at least
50% of the pixels (>24 pixels). All view angles from POLDER pixels centred
at these 7 x 7 km from June 15 to 30 are used. The Four-Scale Linear Model
for AnIsotropic Reflectance (FLAIR) (White et al., 2000) is used
to parameterise the BRDF of each POLDER pixel location. FLAIR is a linear
kernel-like model developed from the Four-Scale Model (Chen and Leblanc,
1997). While simplifications were performed in developing FLAIR,
effort has been made not to limit the model to specific canopy characteristics
while maintaining direct relationships between canopy architecture and
model coefficients. This has resulted in a model with five architecture-related
descriptors of the canopy: shaded and sunlit foliage reflectance, shaded
and sunlit background reflectance, and the canopy gap probability. Although
FLAIR can be inverted directly (e.g. by using the simplex method), the
Powell method (Press et al.,1994) was used to retrieve the five FLAIR parameters,
using a negative merit function when reflectivity and proportion parameters
were outside the 0-1 range and when the reflectivities of shaded foliage
or background were larger than their sunlit counterparts. The Powell method
was chosen because it allows comparison with any models, including the
models that can be used only in forward mode. By using the retrieved
parameters in FLAIR at a common solar zenith angle of 35 degrees, the hotspot
and darkspot reflectances can be obtain to calculate any of the anisotropic
indices of Table 1.
|
|||||||||
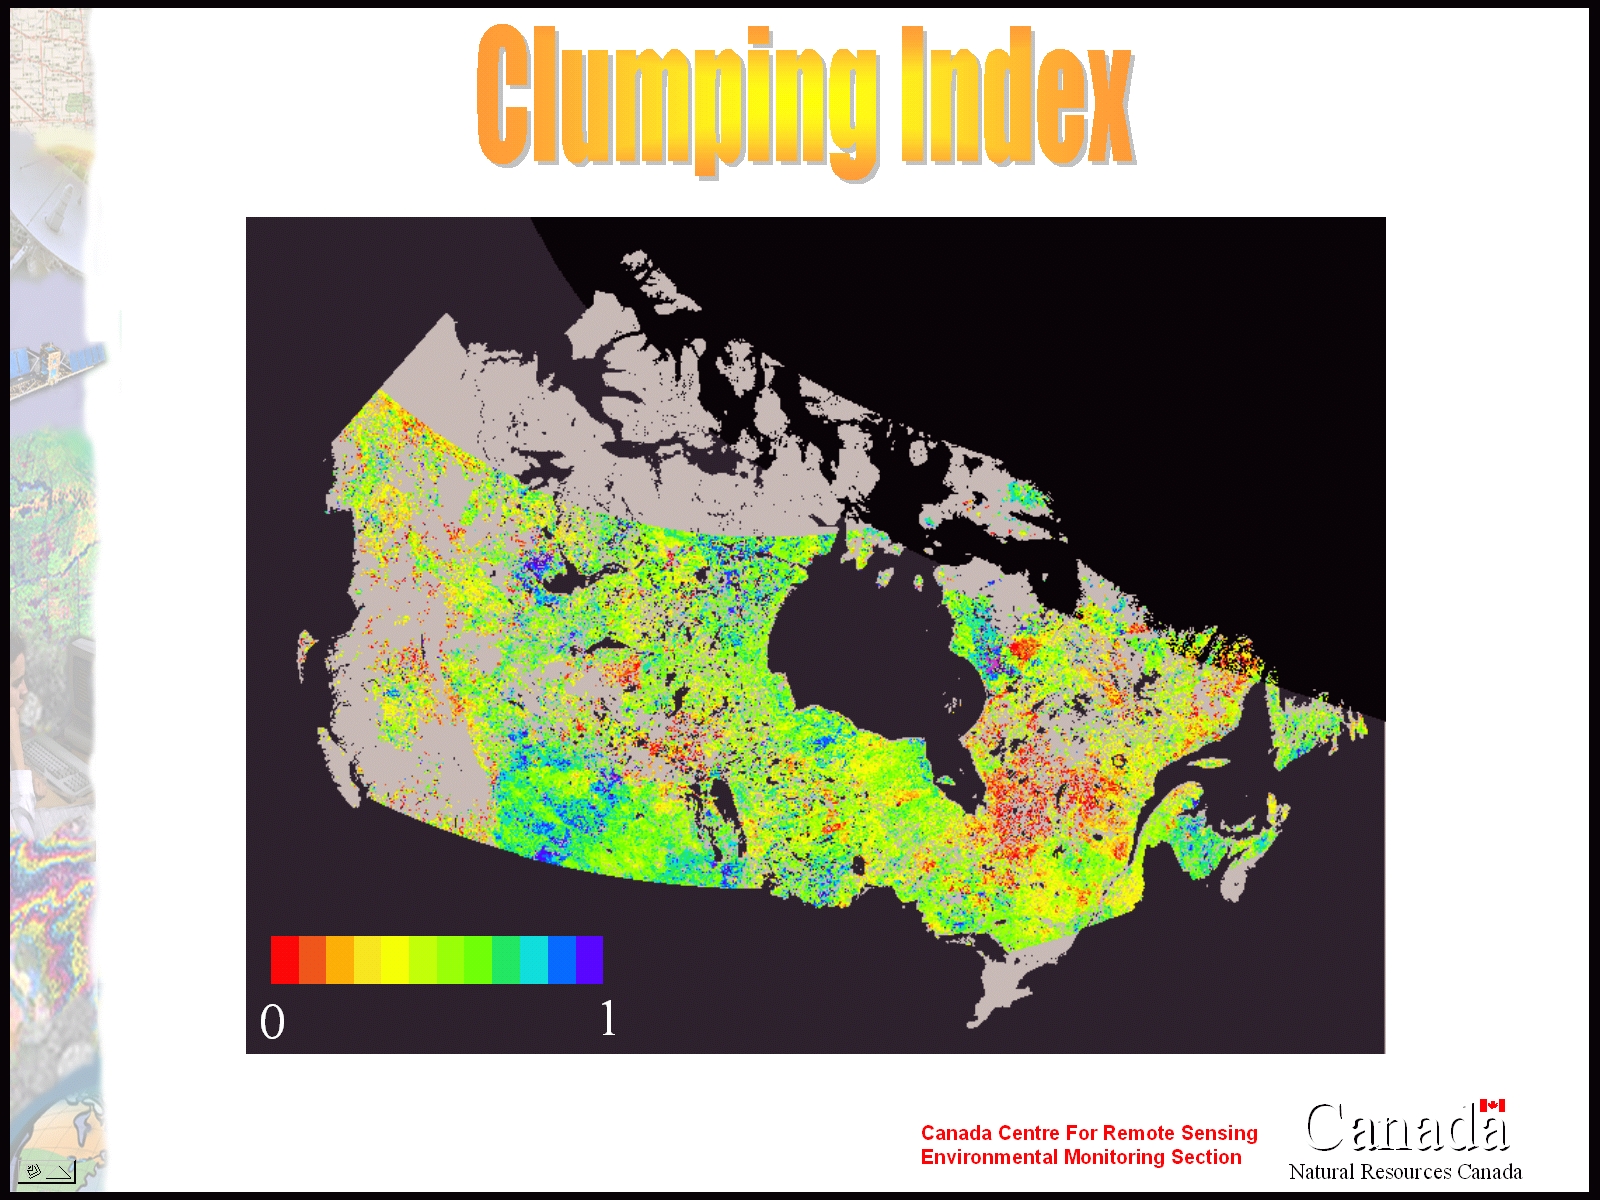
Fig. 6: Clumping Index map made from directional near-infrared POLDER data taken between June 15 and 30, 1997. |
|||||||||
| Fig. 6 shows a clumping index map of Canada based on the NDHD from FLAIR interpolated near-infrared level-2 spaceborne POLDER data using eq. 5. The near infrared was chosen because it gave better correlation based on the Five-Scale simulations, but also because FLAIR gave better R2 fits with the POLDER data with that band. The brighter the pixels in the map, the more clumped they are. Generally the clumping index maps give expected results with large clumping index (low clumping) in the Canadian prairies and lower index (high clumping) in the Quebec part of the James Bay area where many black spruce forests are found. Some of the "missing pixels" in the map can be explain by pixels contaminated by small lakes that gave a darkspot larger or comparable to the hotspot because of specular reflectance (Lacaze, 1999). Other pixels did not meet the requirement of at least 50% of one cover type in the 7 by 7 window. | |||||||||
| 5-VALIDATION
A methodology to validate continental and global clumping index maps
using directional remote sensing images at different scales is proposed
based on the strategy used in the Canadian LAI validation project (Chen
et al., 2000a). The LAI validation project already includes measurements
of clumping index in different canopies and scaling of high-resolution
images to scales appropriate to continental and global studies, 1-7 km
pixel ground. Larger ground truth plots than those used for the LAI
validation are expected from clumping index validation because of the available
directional data from MISR and POLDER, unless airborne data is used instead.
The best pixel ground size of the directional sensors is from the MISR
sensors with 275 m and is much larger than the nadir-looking LANDSAT TM
(30 m) employed in the LAI validation. The alternative of using airborne
directional measurements to achieve a smaller plot size is constrained
by cost, but clumping index maps based on the fine resolution may then
be compared with those derived from the targeted satellite data. The problems
arising from using sensors with different wavelength has been tackled for
the LAI retrieval. It was shown that a simple correlation can be
used between sensors that do not have exactly the same bands (Chen et al.,
2000a). MISR and POLDER have very similar red and near-infrared band
so it is expected that the same relationship is applicable to both sensors.
|
|||||||||
| 6-DISCUSSION/CONCLUSION
A proposed methodology and application example of foliage clumping retrieval
from directional satellite measurements has been shown. Five-Scale simulations
showed that the NDHD index based on the hotspot and darkspot in the near
infrared exhibits a very linear behaviour with clumping index. The NDHD
is also not very much influenced by other biophysical parameters such as
the LAI. Many aspect of the retrieval showed here can and will be improved,
such as the specular reflection of water that contaminates pixels, and
using data from more days to get more good pixels. A first map of clumping
was done with available POLDER data from June 1997. MISR data may be used
to produce clumping maps that could be more easily compared with surface
measurements of clumping index. Finally, a validation strategy was proposed
in order to assess the accuracy of the clumping index map.
|
|||||||||
| ACKNOWLEDGMENT
We would like to thank Mr. Kevin Butler for its help in developing the
software used in the POLDER data extraction. Five-Scale and the POLDER
extraction software are available on request.
REFERENCES: Chen (1996) "Optically-based methods for measuring seasonal variation in leaf area index of boreal conifer forests". Agricultural and Forest Meteorology, 80:135-163 Chen, J. M. and S.G. Leblanc. (1997) "A Four-Scale Bidirectional Reflectance Model Based on Canopy Architecture." IEEE Trans. GeoSci Remote Sens, vol. 35, pp.1316-1337 Chen, J. M. and S.G. Leblanc, (2000). "A Geometrical multiple scattering scheme to be used in geometric-optical models." IEEE Trans. GeoSci Remote Sens (in press) Chen, J. M., R. Lacaze, S.G. Leblanc, J.-L., Roujean, and J. Liu (1999) "POLDER BRDF and photosynthesis: an angular signature useful for ecological applications," Abstract to 2nd international workshop on multiangular measurements and models, Ispra, Italy. Chen, J. M., G. Pavlic , L. Brown, J. Cihlar, S.G. Leblanc, H. P. White, R. J. Hall, D. Peddle, D.J. King, J. A. Trofymow, E. Swift, J. Van der Sanden, and P. Pellikka (2000a) "Validation of Canada-wide leaf area index maps using ground measurements and high and moderate resolution satellite imagery." Submitted to Int. J. for Remote Sensing Chen, J. M. , J. Liu, S. G. Leblanc, J.-L. Roujean, and R. Lacaze (2000b) "Utility of Multi-angle Remote Sensing for Terrestrial Carbon Cycle Modelling ." (This issue) Cihlar, J., J. Beaubien, R. Latifovic, and G. Simard. (1999). "Land cover of Canada Version 1.1." Special Publication, NBIOME Project. Produced by the Canada Centre for Remote Sensing and the Canadian Forest Service, Natural Resources Canada. Lacaze, R. (1999) "Restitution des paramètres des surfaces continentales utiles à lĺétude du climat à partir des observations multiangulaires des la télédétection optique" PhD Thesis, 236 pages. Leblanc, S. G. and J. M. Chen (2000) "A Graphic User Interface (GUI) for the FIVE-Scale Model for fast BRDF Simulations." Proceeding of the 2nd international Workshop on Multiangular Measurements and Model, Ispra, Italy. Rem. Sens. Review (in press) Kucharik, C. J., J. M. Norman, L. M. Murdock and S. T. Gower, (1997). "Characterizing canopy nonrandomness with a Multiband Vegetation Imager (MVI). J. Geophy. Res.vol. 102, No. D24, pp. 29,455-29,473. Nilson T., (1971) "A theoretical analysis of the frequency of gaps in plant stands." Agric. For Meteorol., 8:25-38. Press, W. H., S.A. Teukolsky, W.T. Vetterling and B. P. Flannery. (1994) "Numerical Recipes in C", Cambridge University Press, 994 pages. Sandmeier, St., Ch. Muller, B. Hosgood, and G. Andreoli. (1998) "Physical Mechanisms in Hyperspectral BRDF data of Grass and Watercress" Remote Sens. Environ. Vol 66, pp. 222-233. White, H. Peter, J. R. Miller and J. M. Chen (2000), "Four-Scale Linear
Model for Anisotropic Reflectance (FLAIR), I. Model Description and Partial
Validation", IEEE Trans. GeoSci Remote Sens (in press).
|