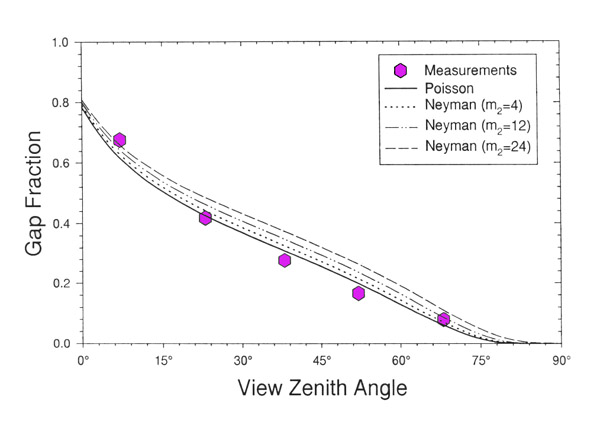
Figure 11: Canopy gap fraction modeled with different Neyman group sizes as compared
with the measurements from a black spruce forest.