What is TRAC?
TRAC is a new optical instrument for measuring the Leaf Area
Index (LAI) and the Fraction of Photosynthetically
Active Radiation absorbed by plant canopies (FPAR).
TRAC measures canopy 'gap size' distribution in addition to
canopy 'gap fraction'. Gap fraction is the percentage of gaps
in the canopy at a given solar zenith angle. It is usually
obtained from radiation transmittance. Gap size is the physical
dimension of a gap in the canopy. For the same gap fraction,
gap size distributions can be quite different.
TRAC
manual for download
Why do we measure gap size?
Plant canopies, especially forests, have distinct architectural
elements such as tree crowns, whorls, branches, shoots, etc.
Since these structures dictate the spatial distribution of
leaves, this distribution cannot be assumed to be random.
Previous commercial instruments have been based on the gap
fraction principle. Because of foliage clumping in structured
canopies, those instruments often considerably underestimate
LAI. A canopy gap size distribution contains information of
canopy architecture and can be used to quantify the effect
of foliage clumping on indirect (i.e., non-destructive) measurements
of LAI.
How is the
gap size distribution measured?
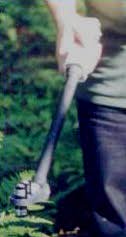
TRAC (including the recording and data analysis components)
is hand-carried by a person walking at a steady pace (about
0.3 meter per second). Using the solar beam as a probe, TRAC
records the transmitted direct light at a high frequency.
Figure 1 shows an example of such
measurements where each spike, large or small, in the time
trace represents a gap in the canopy in the sun's direction.
These individual spikes are then converted into gap size values
to obtain a gap size distribution shown in Figure 2. The curve in Figure 3 is an accumulated gap fraction
from the largest to the smallest gap. The total accumulated
gap fraction on the ordinate (at gap size of zero) is the
gap fraction that is usually measured from the radiation transmittance.
A gap size distribution curve like this reveals the composition
of the gap fraction and contains much more information than
the conventional gap fraction measurements.
Can we quantify
the clumping effect from a gap size distribution?
Yes. A gap size distribution, contains many gaps which result
from non-randomness of the canopy, such as the gaps between
tree crowns and branches. Since we know the distribution for
a random canopy, Fr in Figure 3 (Miller and Norman, 1991),
the gaps resulting from non-randomness can be identified and
excluded from the total gap fraction accumulation using a
gap removal method (Chen and Cihlar, 1995a). The difference
between the measured gap fraction and the gap fraction after
the gap removal can then be used quantify the clumping effect.
Has this new
method been validated?
TRAC technology has been validated in several studies (Chen
and Cihlar, 1995a; Chen, 1996a, Chen et al., 1997; Kucharik
et al., 1997). These studies showed that instruments based
on gap fraction, such as LI-COR LAI-2000, measure the effective
LAI under the assumption of random leaf spatial distribution.
In forests, the effective LAI is generally only 30% to 70%
of the true LAI because of foliage clumping. The clumping
index obtained from TRAC can be used to convert effective
LAI to LAI. When TRAC is used for half a clear day, an accurate
LAI value for a stand can also be obtained using TRAC alone.
It is recommended (Chen et al., 1997) that TRAC be used to
investigate the foliage spatial distribution pattern while
LAI-2000 is useful to study foliage angular distribution pattern.
The combined use of TRAC and LAI-2000 allows quick and accurate
LAI assessment of a canopy.
Are there any other uses of TRAC?
The following uses of TRAC have been demonstrated:
- the measurement of photosynthetic flux density (PPFD)
along a transect is the best way to obtain the mean value
of the transmitted light through the canopy, and it has
been successfully used to quantify the fraction of photosynthetically
active radiation (FPAR) absorbed by the canopy (Chen, 1996b);
- the gap size distribution can be used to estimate several
canopy architectural parameters including foliage clump
size and area, and foliage element size (Chen and Cihlar,
1995b);
- the gap size distribution has been used to model the hotspot
and the bi-directional reflectance distribution function
(BRDF) of the optical remote sensing signal from plant canopies
(Chen and Leblanc, 1997). We believe you can find new uses
of this new instrument.
Is TRAC commercially
available?
Yes. The instrument is commercially available. For more information,
please contact:
3rd Wave Engineering
14 Aleutian Road
Nepean, Ontario
Canada, K2H 7C8
Attention: Mr. Mike Kwong
Tel: (613)828-2195
Fax: (613)828-9498
Email: mikek@3wce.com
References
Chen, J. M., P. M. Rich, T. S. Gower, J. M. Norman, S. Plummer,
1997. "Leaf area index of boreal forests: theory, techniques
and measurements". Journal of Geophysical Research, 102(D24):29,429-29,444.
Chen, J. M., 1996a. "Optically-based methods for measuring
seasonal variation in leaf area index of boreal conifer forests".
Agricultural and Forest Meteorology, 80:135-163.
Chen, J. M., 1996b. "Canopy architecture and remote sensing
of the fraction of photosynthetically active radiation in
boreal conifer stands". IEEE Transactions on Geoscience
and Remote Sensing, 34:1353-1368.
Chen, J. M. and J. Cihlar, 1995a. "Quantifying the effect
of canopy architecture on optical measurements of leaf area
index using two gap size analysis methods". IEEE Transactions
on Geoscience and Remote Sensing, 33:777-787.
Chen, J. M. and J. Cihlar, 1995b. "Plant canopy gap size
analysis theory for improving optical measurements of leaf
area index". Applied Optics, 34:6211-6222.
Chen, J. M. and S. Leblanc, 1997. "A 4-scale bidirectional
reflection model based on canopy architecture". IEEE Transactions
on Geoscience and Remote Sensing, 35:1316-1337.
Kucharik, C. J., J. M. Norman, L. M. Murdock and S. T. Gower,
1997. "Characterizing canopy nonrandomness with a Multiband
Vegetation Imager (MVI)". Journal of Geophysical Research,
102(D24): 29455-29473.
Miller, E. E. and J. M. Norman, 1971. "A sunfleck theory
for plant canopies. I length of sunlit segments along a transect".
Agronomy Journal, 63:735-738.
|