
|
For Command line mode click here |
| Plane Mode |
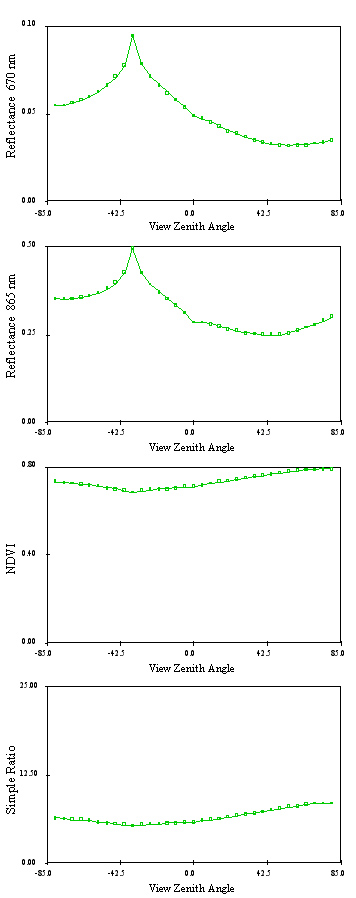
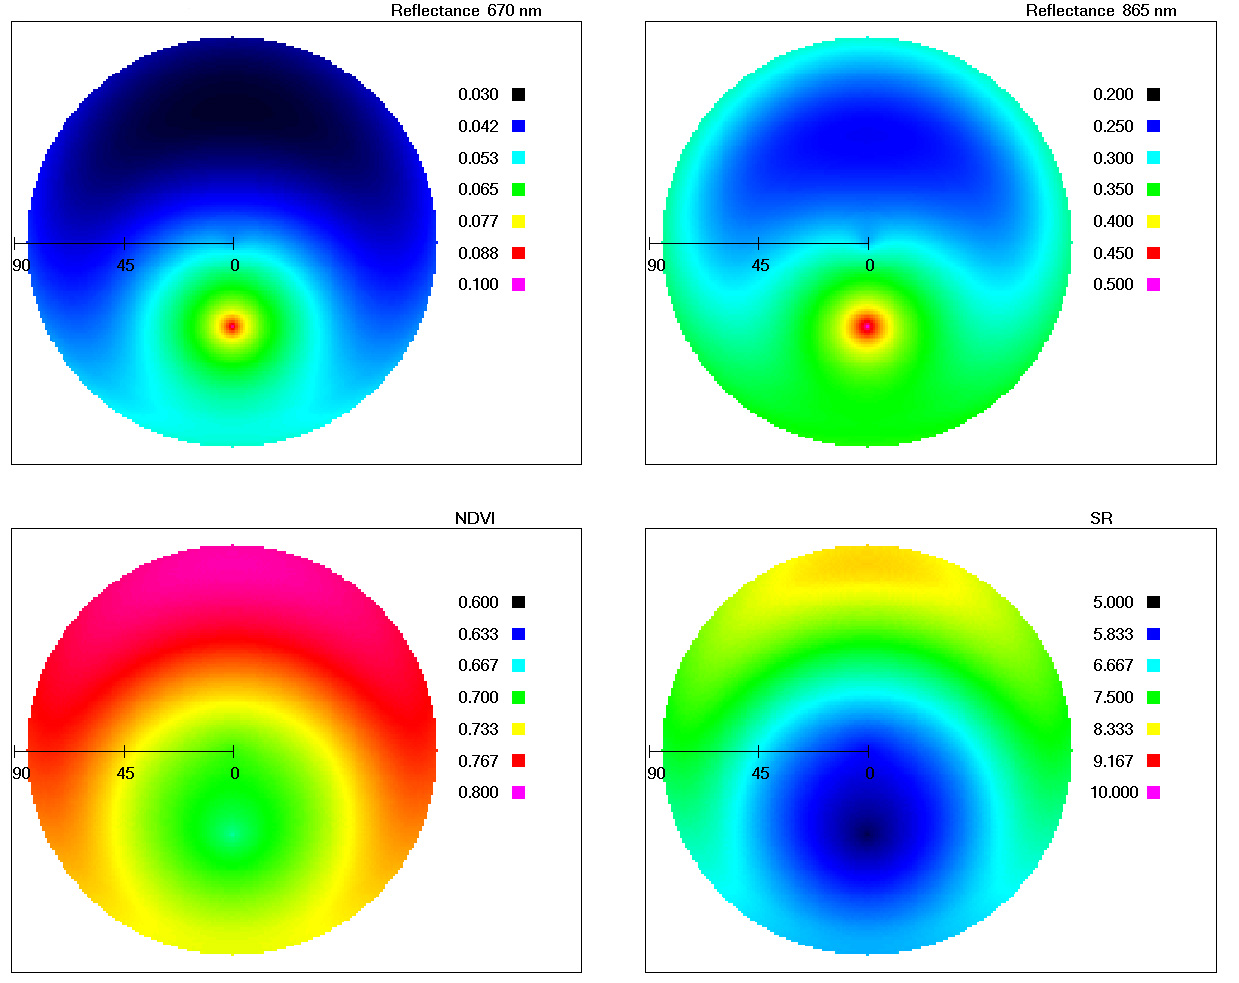
| This is an example of the output window
in the PLANE mode. By using the scroll bar (once the simulation is done)
various plots can be seen: Reflectance at different wavelength: 670 nm
(red), 865 nm (NIR), vegetation indices: NDVI, SR. Also the
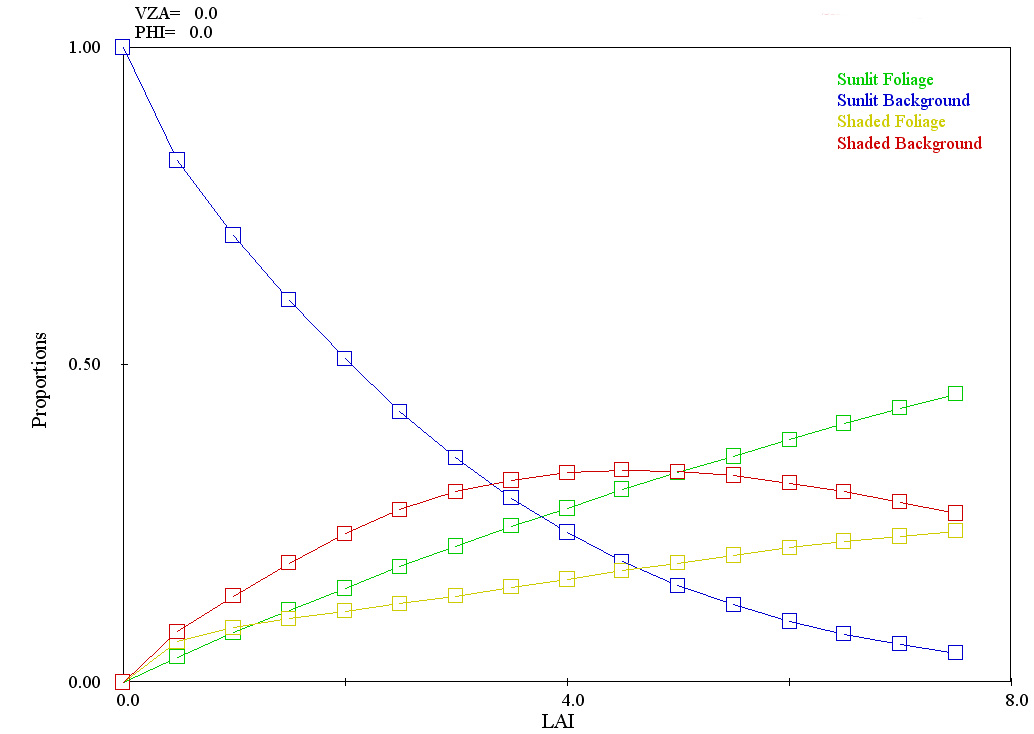
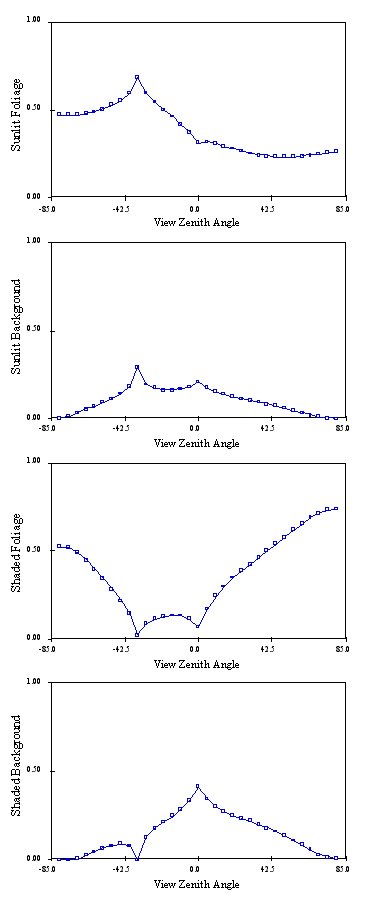
4 components: Crown illuminated
(PT) and shaded (ZT) and the background illuminated
(PG) and shaded (ZG). The second page has the
reflectance in the SWIR (1600 nm), the RSR (Brown
et al, 2000),
foliage clumping, gap fraction, hot spot, etc. |
| File output: |
| ---PLANE |
| The model (NT/95) allows you to easily choose the output values desired when the SAVE ASCII menu under FILE is activated. (Note the dialog box can have different parameters that can be saved depending on the mode and options used) |
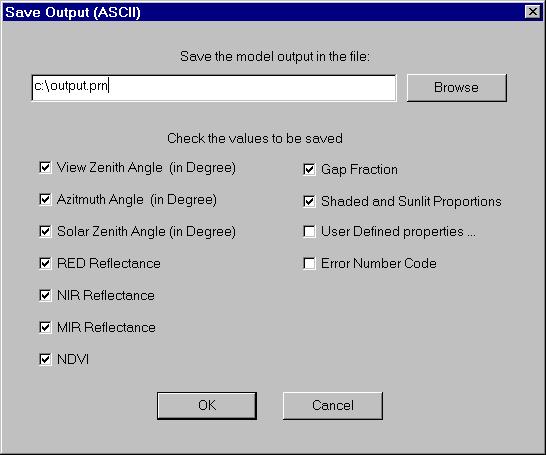 |
| A typical output would look like this: |
| VZA PHI
RED NIR
NDVI PT
PG ZT
ZG WARNINGS
-85.0 0.0 0.0259 0.1907 0.7606 0.2068 0.0000 0.7932 0.0000 1 -84.0 0.0 0.0263 0.1921 0.7590 0.2105 0.0001 0.7895 0.0000 -83.0 0.0 0.0267 0.1936 0.7575 0.2142 0.0003 0.7855 0.0000 -82.0 0.0 0.0271 0.1951 0.7558 0.2180 0.0008 0.7812 0.0000 -81.0 0.0 0.0276 0.1968 0.7542 0.2218 0.0017 0.7764 0.0000 -80.0 0.0 0.0280 0.1985 0.7524 0.2257 0.0033 0.7710 0.0000 -79.0 0.0 0.0285 0.2003 0.7506 0.2295 0.0056 0.7649 0.0000 -78.0 0.0 0.0290 0.2022 0.7488 0.2334 0.0086 0.7580 0.0000 -77.0 0.0 0.0296 0.2043 0.7469 0.2372 0.0124 0.7503 0.0000 -76.0 0.0 0.0302 0.2064 0.7450 0.2411 0.0170 0.7419 0.0000 -75.0 0.0 0.0308 0.2087 0.7430 0.2450 0.0224 0.7326 0.0000 |
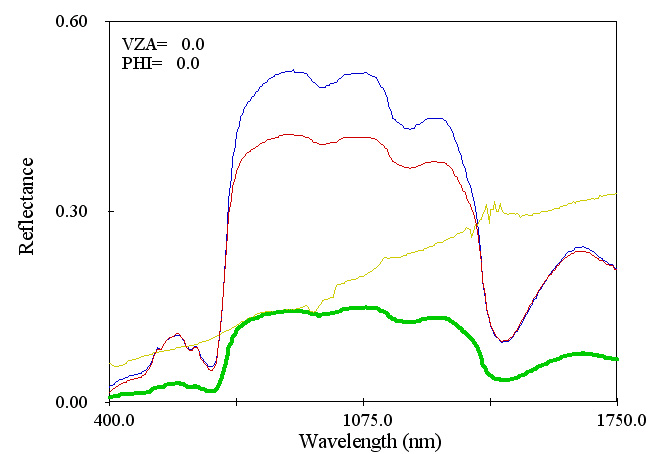
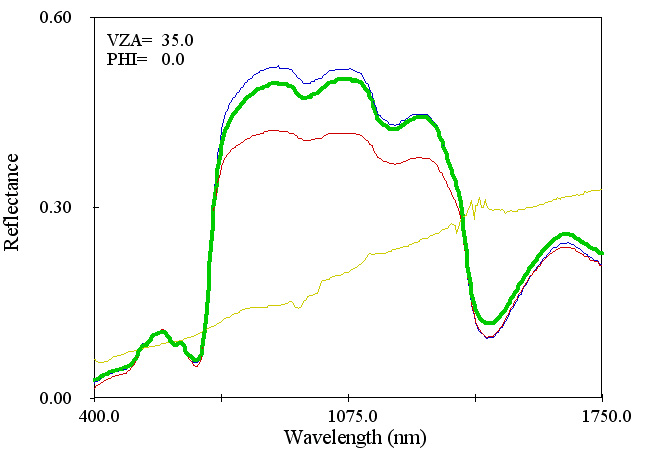
HYPERSPECTRAL
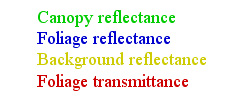
Nadir view: |
Hotspot view: |
 |
|
|