INTRODUCTION
Various inverse modeling techniques (Enting, 2002) are currently
available for estimating regional carbon fluxes using atmospheric
CO2 concentration observations. However, the number of currently
available observation stations is still sparse relative to
the size of the global surface, and this essentially limits
the number of regions that can be reliably inverted globally
without using additional information as constraints to the
inversion. In our study, An inverse modeling system has been
developed based on the Bayesian principle for estimating the
carbon fluxes over a nested framework of 48 regions globally
and with a relatively fine grid of 28 regions over North America
in monthly steps using CO2 concentration measurements of 2003
at 90 atmospheric stations. Preliminary inversion results
of global carbon flux and a carbon flux field over North America
have been obtained.
METHOD
Inversion: We use the Bayesian synthesis method
(Enting, 2002), solving for 37 land regions and 11 ocean regions
(Fig. 1).

Model: NIES (Maksyutov, 2000), with horizontal
resolution of 2.5 by 2.5 degree and 15 sigma vertical level,
is used to perform forward simulation for 3 years to determine
the transport matrix and the effects of distributed prior
flux on baseline station CO2 concentration.
Data: The atmospheric CO2 concentration data
used in this inversion are taken from GLOBALVIEW- CO2 (2004
) for 2003 data. 90 sites are selected as presented is Fig.
1.
Model Data Mismatch Covariance: The diagonal
matrix with diagonal variance is used (Transcom3, Level 2).
Pre-subtracted Fluxes: (i) the four background
fluxes consisted of a 1995 fossil fuel emission field (Brenkert
et al., 1998), (ii) an additional fossil fuel emission field
in 2002 based on increases in the fossil fuel emission inventories
of all countries from 1995 to 2002 (Marland and Boden, 2005),
(iii) seasonal biosphere exchange based on the Biome-BGC model
(Running et al., 1988, 1993), and (iv) air-sea gas exchange
(Takahashi et al., 1999).
Prior Flux Covariance: We use an a priori flux
covariance matrix with each element as a function of regional
area and the a priori flux magnitude.
RESULTS - Annual Flux Estimation
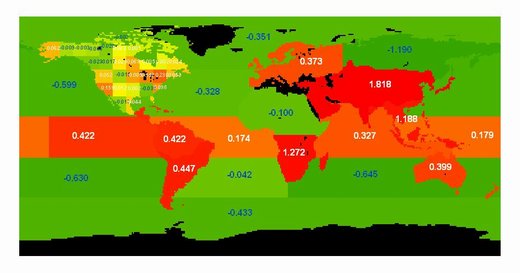
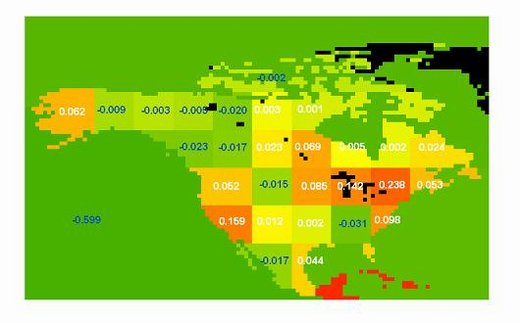
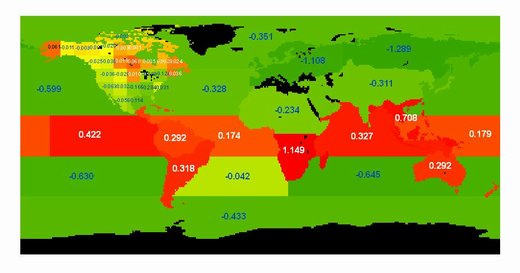

Fig. 2 The inverted annual
carbon flux distributions. (a) Annual total flux to the atmosphere,
including fossil fuel emission, seasonal biosphere exchange,
air-sea exchange, and others. a.2 is the zooming result of
North America. (b) Annual total flux excluding fossil-fuel
emission. b.2 is the zooming result of North America. ( PgC/Year).
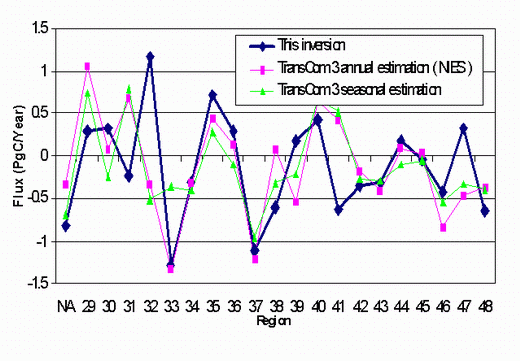
Fig. 3 A comparison of TransCom3
annual results of NIES model and the model mean of TransCom3
Seasonal estimation with those results from this inversion.
Region NA represents the combination of regions 1 to 28 in
this inversion, which is the same as Boreal NA and Temperate
NA of TransCom3. Pink line represents TransCom 3 results (Gurney
et. Al., 2003). Green line represents the model mean results
of TransCom 3 seasonal estimation (Gurney et al., 2004). Blue
line is the results of this inversion.
RESULTS - Seasonal Variation of Estimated Flux
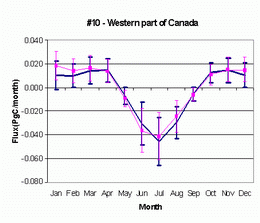 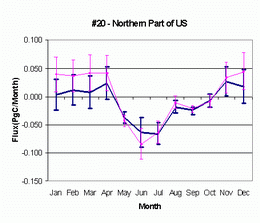
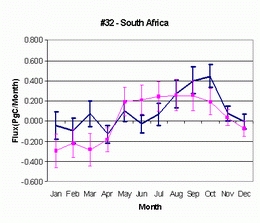 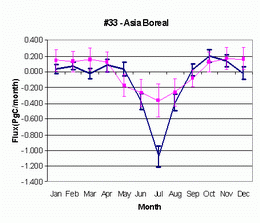
 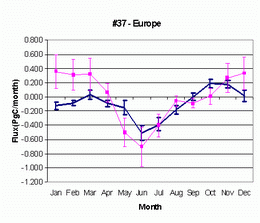
Figure 4 Seasonal patterns
of the a priori flux (pink) and the inverted flux (blue) from
ecosystems and their uncertainty in selected regions.
CONCLUDING REMARKS
- Comparing to the previous TransCom3 inversions, the global
lands and oceans have been a relative steady sink, i.e.,
the total flux from the atmosphere excluding fossil fuel
emissions but including emissions associated with land use
changes. The total sink is 2.93 PgC/year from this inversion,
2.81 PgC/year from the NIES model in TransCom3 annual inversion
(Gurney et al. 2003), and 2.81 PgC/year from the mean of
models used in TransCom3 monthly inversion (Gurney et al.
2004). However the proportion of the contribution from land
and ocean have been changed, with 65.6% attributed to oceans
in this inversion, 57.3% and 47.7% in the aforementioned
two TransCom3 inversions, respectively.
- As in TransCom3 inversions, northern lands are the largest
sinks. North America contributes a sink of 0.83PgC/year,
with a weak sink of 0.063 PgC/year in Canada. Most of south
lands, however, have changed into sources. The only exception
occurred in Africa, where we are on the opposite end of
TransCom 3 inversions.
- All of the four tropical ocean regions release carbon
to atmosphere annually, and uptakes occurred in all other
ocean regions, in agreement with Takahashi et al. (1999)
while in Transcom3 inversions, only one of the four is a
source.
- Most of the inversion results show that deviations from
the a priori flux occurred in winter and summer seasons.
Future Work: As all of the inversion results
are based on Global-View 2003 CO2 dataset, we will do this
inversion for more years to investigate the long-term changes.
Another ecosystem model BEPS (Liu et al, 1999) will be used
to produce an different a carbon flux field based on remote
sensing to see how sensitive of the inversion is to the a
priori flux field.
References
- Enting, I. G. (2002), Inverse Problems in Atmospheric
Constituent Transport, Cambridge University Press, Cambridge
and New York.
- Gurney, K. R., et al. (2003), Transcom 3 CO2 Inversion
Intercomparison: 1. Annual mean control results and sensitivity
to transport and prior flux information, Tellus, Ser. B,
55, 555¨C 579
- Gurney, K. R., et al. (2004), Transcom 3 inversion intercomparison:
Model mean results for the estimation of seasonal carbon
sources and sinks, GLOBAL BIOGEOCHEMICAL CYCLES, VOL. 18,
GB1010
- Maksyutov, S., and G. Inoue, Vertical profiles of radon
and CO2 simulated by the global atmospheric transport model,
CGER/NIES-I039-2000 (7), 39-41, 2000
- Brenkert AL, Marland G, Boden TA, Andres RJ, Olivier JG
(1997) CO2 emissions from fossil fuel burning: Comparisons
of 1990 gridded maps and an update to 1995. Transactions,
AGU. 78:111.
- Marland G., et al.,(2005) National CO2 Emissions from
Fossil-Fuel Burning, Cement Manufacture, and Gas Flaring:
1751-2002, http://cdiac.esd.ornl.gov/trends/emis/en_cont.htm.
- Takahashi, T., et al. (1999). Net sea-air CO2 flux over
the global oceans: An improved estimate based on the sea
¨Cair pCO2 difference, paper presented at 2nd CO2 in
Oceans Symposium, Cent. for Global Environ. Res. Natl. Inst.
for Environ. Stud., Tsukuba, Japan.
- Liu, J., J. M. Chen, J. Cihlar, W. Chen (1999), Net primary
productivity distribution in BOREAS region from a process
model using satellite and surface data, J. Geophy. Res.,
104, 27735-27754.
|