Application 1:
Global Mapping of Foliage Clumping Index Using Multi-Angular
Satellite Data
Global mapping of the vegetation clumping index is attempted
for the first time using multi-angular POLDER 1 data based
on a methodology that has been demonstrated to be applicable
to Canada's landmass. The clumping index quantified the level
of foliage grouping within distinct canopy structures, such
tree crowns, shrubs, and row crops, relative to a random distribution.
Vegetation foliage clumping significantly alters its radiation
environment and therefore affects vegetation growth as well
as water and carbon cycles. The clumping index is useful in
ecological and meteorological models because it provides new
structural information in addition to the effective LAI retrieved
from mono-angle remote sensing and allows accurate separation
of sunlit and shaded leaves in the canopy. The relationship
between an angular index (normalized difference between hotspot
and darkspot) and the clumping index is explored using a geometrical
optical model named "4-Scale". A simplified version of the
mechanistic hotspot model used in 4-Scale is developed to
derive the hotspot reflectance from multi-angle measurements
for mapping purposes. An accurate clumping map for areas with
significant tree (shrub) covers has been achieved, although
further research is required to reduce topographic effects.

Figure 1. Modeled NDHD vs. clumping
index (Omega) for a wide range of parameters highlighting
the distributions of individual parameters within the cluster.
The SZA was chosen as 35 for all simulations
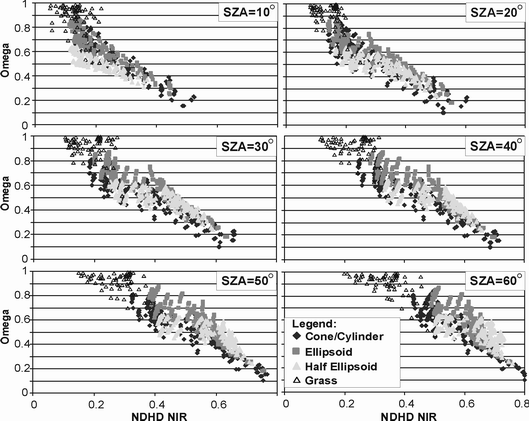
Figure 2. Modeled NDHD vs. clumping
index (Omega) for a range of parameters covering the full
range for both variables to highlight the effect of crown
shape and solar illumination angle as well as the results
for Grassland.

Figure 3. POLDER (NIR and Red) directional
reflectance from June 1997 along the principal plane for a
single resolution element in A) Broadleaved, evergreen; B)
Needle-leaved, evergreen; C) Herbaceous cover, open; and D)
Shrub Cover, deciduous; land cover types (GLC2000). A negative
scattering angle was assigned to indicate the backscattering
direction
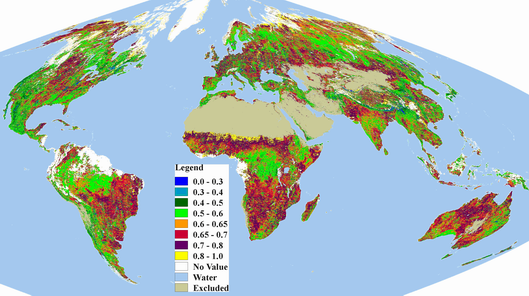
Figure 4. Global vegetation clumping
index map derived from POLDER 1 data using the normalized
difference between interpolated hotspot and darkspot NIR reflectance
and applied to vegetated land cover. Vegetation clumping increases
with decreasing values of the index
Application 2:
Retrieving Forest Background Reflectance in a Boreal Region
from Multi-angle Imaging SpectroRadiometer (MISR) Data
Studies of the bidirectional behavior of forest canopy have
shown that the total reflectance of a forest canopy is the
combination of illuminated and shaded components of the tree
crown as well as the background. In this study, we estimate
the background potion from the bidirectional reflection observed
by Multi-angle Imaging SpectroRadiometer (MISR) instrument
which scans the earth in nine different view angles in an
oblique plane relative to the sun. The nadir and 60o forward
directions of the MISR images were used to derive the reflectivity
of the forest background based on the probabilities of viewing
the illuminated tree crown and background on those view angles.
The probabilities were estimated using the Four-Scale model.
In the study, background reflectivity mosaic images in red
and NIR wavelengths covering the BOREAS region during winter
and spring seasons were obtained. The mosaic images of winter
show high background reflectivity in both wavelengths, and
in most of the areas the reflectivity was more than 0.3. In
mosaic images of spring the spatial variations in the background
reflectivity were considerable. The seasonal changes in the
background reflectivity were also studied with multi temporal
MISR data, and a similarity in the temporal pattern was found
between the retrieved forest background reflectivity and grass
land reflectance. These spatial and temporal patterns of the
background component retrieved from MISR would be critically
important in retrieving the biophysical parameters of vegetation
and in ecosystem modeling.

Figure 1: The variation
of the total reflectance of a forest canopy in a red band
with view zenith angle on the perpendicular plane for two
contrasting background types

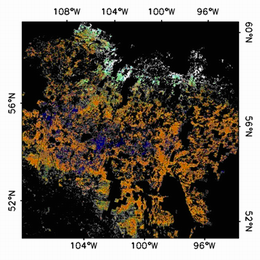


Figure 2: Background reflectivity
of forest area (a) RED band in winter (b) RED band in spring
(c) NIR band in winter (b) NIR band in spring

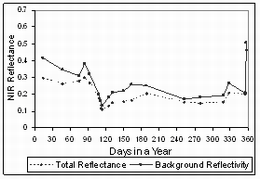
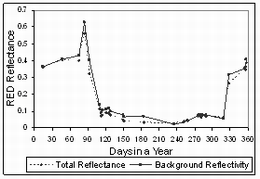

Figure 3: Background reflectivity
and its temporal changes of (a) coniferous forest in the red
band, (b) coniferous forest in the NIR band, (c) deciduous
forest in the red band; (d) deciduous forest in the NIR band

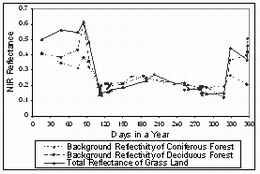
Figure 4: Comparison of
retrieved background reflectivity in coniferous and deciduous
forests with open grassland reflectance in (a) red and (b)
NIR wavelengths
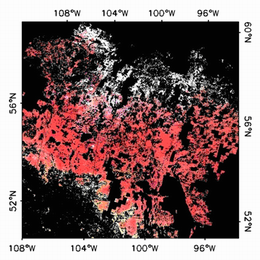
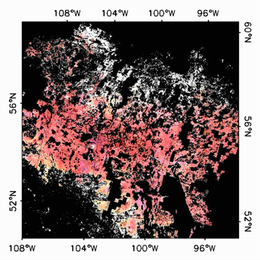
Figure 5: RGB color composites
of forest areas in spring. (a) NIR, Red and Green bands of
MISR nadir reflectance data, and (b) NIR, Red and Green background
reflectivities retrieved using MISR data.
Reference:
Chen, J. M., C. H. Menges, and S. G. Leblanc, 2005. Global
derivation of the vegetation clumping index from multi-angular
satellite data. Remote Sensing of Environment, 97:
447-457
|