What is Net
Primary Productivity (NPP)?
NPP is a parameter used to quantify the net carbon absorption
rate by living plants. NPP is the difference between plant
photosynthesis and respiration which releases part of the
carbon absorbed, that is,
 NPP = Photosynthesis Rate - Plant Respiration Rate NPP = Photosynthesis Rate - Plant Respiration Rate
(expressed in units of gram carbon/square metre/year)
Why is NPP important?
- NPP is a measure of plant growth. It provides highly synthesized,
quantitative information for sustainable resource management.
- NPP is an important component of the biosphere carbon
cycle, which is an important aspect of global climate change
studies, i. e.,
Net Carbon Flow to/from Terrestrial Ecosystems (NEP) = NPP -
Soil Respiration (gram carbon/square metre/year)
How is NPP
estimated at CCRS?
A process-based computer model, the Boreal Ecosystem Productivity
Simulator (BEPS) in Figure 1, has been developed
to mimic plant growth and provide estimates of NPP. BEPS computes,
in daily steps: soil water balance, stomatal conductance,
sunlit and shaded leaf area index, sunlit and shaded leaf
gross photosynthesis, total gross canopy photosynthesis, maintenance
and growth respiration of leaves, stems and roots. It outputs
NPP, evapotranspiration, and other parameters of interest.
These values can be computed for individual stands or larger
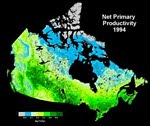
areas. In the current implementation, BEPS results are provided
for each 1 km2 (100 hectares) of Canada in Figure 2 because of the resolution
of the satellite data. In the future, we expect to compute
Canada-wide estimates with better resolution, between 6 and
25 hectares.
Remote sensing inputs for BEPS are leaf area index (LAI)
(10-day intervals) and land cover (yearly). Meteorological
inputs include daily values of maximum and minimum air temperature,
total solar radiation, mean humidity, and total precipitation.
Soil data used are the available soil water capacity (or soil
texture). Both meteorological and soil data are gridded in
the same resolution and map projection as the remote sensing
inputs.
What are the advantages of BEPS?
- Made possible the production of the first-ever NPP map
over Canada at 1 km resolution in Figure 2.
- Satellite data are used to provide information on land
cover and the seasonal variation in leaf area.
- Canopy photosynthesis is calculated using the leaf-level
Farquhar's model after spatial scaling to the canopy and
temporal integration to one day. The spatial scaling is
made using a sunlit-shaded leaf separation method. The daily
integration is achieved by considering the diurnal variability
of meteorological conditions. An analytical solution to
a simplified daily integration of the Farquhar's model is
derived and used in BEPS. The non-linear effects of these
conditions on carbon dioxide uptake prevented us from using
arithmetic daily means. The simple big-leaf photosynthesis
model was abandoned in the recent version of BEPS because
of its inability to consider the non-linear effects of meteorological
conditions on photosynthesis.
- Evapotranspiration is calculated using the Penman-Monteith
model, but the canopy conductance calculation is modified
to consider the non-linear effect of radiation on stomatal
conductance in daily step calculations.
- The effects of the distinct canopy architecture on radiation
absorption and sunlit-shaded leaf separation are considered
through the use of a simple clumping index.
The index was derived from measurements of TRAC.
Why use satellite data?
- Rapid coverage of large areas
- Detection of inter-seasonal and inter-annual variations
- Consistent data quality
- No damage to plants
- Cost effectiveness
Do we validate
the NPP maps?
Yes. The validation was first carried out using plot biomass
data from Quebec converted to NPP. Recently, detailed validation
was carried out using data from the BOReal Ecosystem-Atmospheric
Study (BOREAS) in Figures 3 and 4. Using simultaneous
carbon dioxide flux measurements above and below forest canopies,
it was possible to validate NPP calculations at hourly and
daily time steps for the first time. In this way, the components
of BEPS could also be validated. They include gross photosynthesis,
autotrophic respiration, radiation absorption, evapotranspiration,
rainfall interception, and others. NPP will be further validated
at landscape level.
References
Cihlar, J., J. M. Chen, Z. Li. 1997. "Seasonal AVHRR Multichannel
Data Sets and Products for Scaling up Biospheric Processes".
Journal of Geophysical Research 102:29625-29640.
Liu J., J.M. Chen, J. Cihlar and W.M. Park. 1997. "A
Process-Based Boreal Ecosystem Productivity Simulator Using
Remote Sensing Inputs". Remote Sensing of Environment,
62,158-175.
Running, S. W., and J. C. Coughlan. 1988. "A General Model
of Forest Ecosystem Processes for Regional Applications I.
Hydrological Balance, Canopy Gas Exchange and Primary Production
Processes". Ecological Modelling 42: 125-154.
|

