Application 1:
Modeling dynamics of stable carbon isotopic exchange between
a boreal forest ecosystem and the atmosphere
Stable isotopes of CO2 contain unique information
on the biological and physical processes that exchange CO2
between terrestrial ecosystems and the atmosphere. In
this study, we developed an integrated modeling system to
simulate dynamics of stable carbon isotope of CO2,
as well as moisture, energy, and momentum, between a boreal
forest ecosystem and the atmosphere as well as their transport/mixing
processes through the convective boundary layer (CBL), using
remotely sensed surface parameters to characterize the surface
heterogeneity. It has the following characteristics: (i) it
accounts for the influences of the CBL turbulent mixing and
entrainment of the air aloft; (ii) it scales individual leaf-level
photosynthetic discrimination up to the whole canopy (∆canopy)
through the separation of sunlit and shaded leaf groups; (iii)
it has the capacity of examining detailed interrelationships
among plant water-use efficiency, isotope discrimination and
vapor pressure deficit; (iv) it has the potential to investigate
how an ecosystem discriminates against 13C at various
time and spatial scales. The monthly mean isotopic signatures
of ecosystem respiration (i.e. d13CR) used for
isotope flux calculation are retrieved from the nighttime
flask data from the intensive campaigns (1998 through 2000)
at 20m level on Fraserdale tower, and the data from the growing
season in 1999 are used for model validation. Both the simulated
CO2 mixing ratio and d13CR of CO2
at the 20 m level agreed with the measurements well in different
phases of the growing season. On a diurnal basis, the greatest
photosynthetic discrimination at canopy level (i.e. ∆canopy)
occurred during the early morning and late afternoon with
a varying range of 10‰ to 26‰ The diurnal variability
of ∆canopy was also associated with
the phases of growing season and meteorological variables.
The annual mean ∆canopy in 1999 was
computed to be 19.58‰ The monthly averages of ∆canopy
varied betwen18.55‰ and 20.84‰ with a seasonal peak
during the middle growing season. Due to the strong opposing
influences of respired and photosynthetic fluxes on forest
air (both CO2 and 13CO2)
on both the diurnal and seasonal time scales, CO2
was consistently enriched with the heavier 13C
isotope (less negative d13C) from July to October
and depleted during the remaining months, whereas on a diurnal
basis, CO2 was enriched with the heavier 13C
in the late afternoon and depleted in early morning.
For the year 1999, the model results reveal that the boreal
ecosystem in the vicinity of Fraserdale tower was a small
sink with net uptake of 29.07 g12C m-2
yr-1 and 0.34 g13C m-2 yr-1.
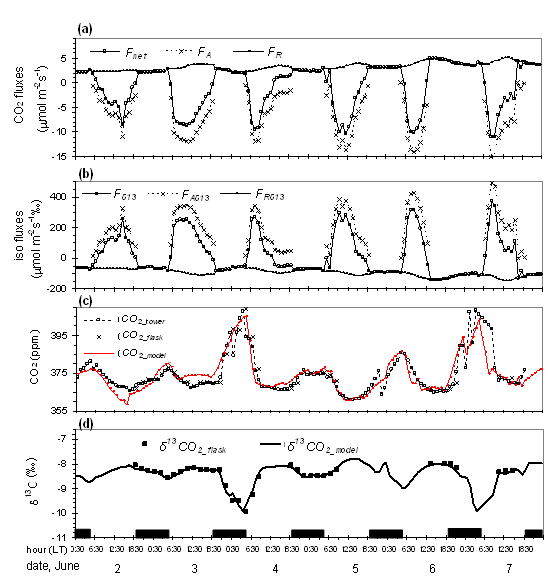
Figure 1, Measured and modeled diurnal
variations in net CO2 flux and mixing ratio in
the surface layer during 2-7, June 1999 at Fraserdale tower
site. (a) simulated CO2 fluxes at the canopy height,
which are net CO2 flux (Fnet), net assimilation
(FA), and total ecosystem respiration (FR);
(b) simulated isofluxes of d13C
(Fd13,
FAd13
, and FRd13)
corresponding to Fnet , FA , and FR
, respectively; (c) simulated and observed CO2
mixing ratios at 20 m height (which are: the observed hourly
mean values (CO2_Tower , which are the
averages of original 6 discrete tower measurements with an
accuracy of 0.1 ppmv; the range of the 6 data points within
an hour is mostly less than 2 ppm), the intensive campaign
data (CO2_flask , which are flask sampled
for around 5 minutes at each corresponding hour), and simulated
hourly averaged data (CO2_model); and
(d) simulated and flask measured d13C
of CO2 at 20 m height.
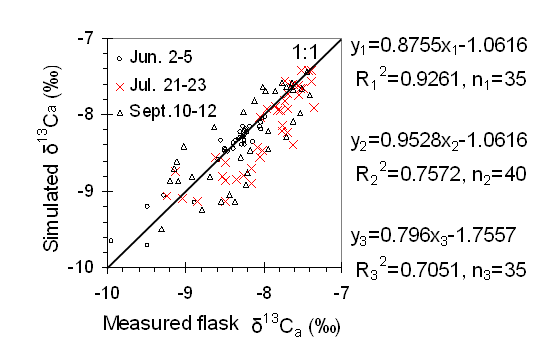
Figure 2, Linear regression relationships
between simulated and measured hourly d13CO2 mixing ratio at 20 m height during the
growing season in 1999 at Fraserdale, Ontario, Canada. Here
y and x represent simulated and observed d13CO2 mixing ratio, respectively; R and n denote
the linear correlation coefficient and sample number, respectively;
subscript 1-3 denotes the campaigns during June 2-7, July
21-23, and September 10-12, respectively.
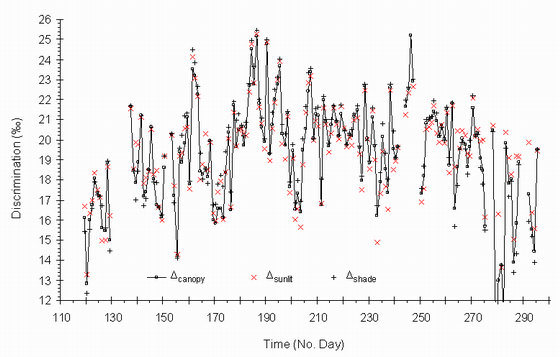
Figure 3, Simulated daily mean photosynthetic
carbon isotope discrimination for the year1999 at Fraserdale
site. The whole-canopy integrated discrimination (∆canopy)
and the discriminations for sunlit leaves (∆sunlit)
and shaded leaves (∆shade) are shown
here for comparison.
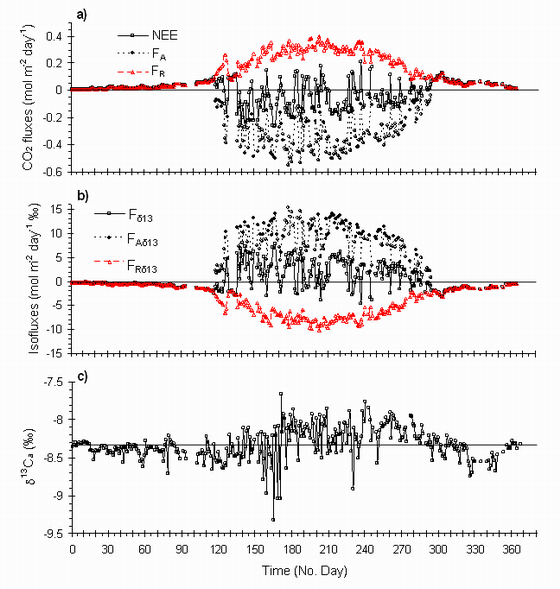
Figure 4, Simulated seasonal variations
in CO2 fluxes, in isofluxes, and in d13C of CO2 at 20 m (d13Ca) for the year1999 at Fraserdale tower
site. (a) daily mean CO2 fluxes, (b) daily mean
isofluxes, and (c) daily mean d13Ca. Note that the true direction of the 13CO2
flux is downward during photosynthesis periods. The isoflux
associated with the net uptake of 13CO2 is positive.
The solid horizontal line in panel (c) indicates the annual
mean d13Ca (= -8.327‰).
Application 2:
Simulating dynamics of d13C of CO2 in the planetary
boundary layer over a boreal forest region: Covariation between
surface fluxes and atmospheric mixing
Stable isotopes of CO2 contain unique information
on the biological and physical processes that exchange CO2
between terrestrial ecosystems and the atmosphere. Ecosystem
exchange of carbon isotopes with the atmosphere is correlated
diurnally and seasonally with the planetary boundary layer
(PBL) dynamics. The strength of this kind of covariation affects
the vertical gradient of d13C and thus the global d13C distribution pattern. We need to understand the various processes involved in transport/diffusion
of carbon isotope ratio in the PBL and between the PBL and
the biosphere and the troposphere. In this study, we employ
a one-dimensional vertical diffusion/transport atmospheric
model (VDS), coupled to an ecosystem isotope model (BEPS-EASS)
to simulate dynamics of 13CO2 in the
PBL over a boreal forest region in the vicinity of the Fraserdale
tower (49°52’29.9”N, 81°34’12.3”W)
in northern Ontario, Canada. The data from intensive campaigns
during the growing season in 1999 at this site are used for
model validation in the surface layer. The model performance,
overall, is satisfactory in simulating the measured data over
the whole course of the growing season. We examine the interaction
of the biosphere and the atmosphere through the PBL with respect
to d13C on diurnal and seasonal
scales. The simulated annual mean vertical gradient of d13C in the PBL in the
vicinity of the Fraserdale tower was about 0.25‰ in 1999.
The d13C vertical gradient
exhibited strong diurnal (29%) and seasonal (71%) variations
that do not exactly mimic those of CO2. Most of
the vertical gradient (96.5% ±) resulted from covariation
between ecosystem exchange of carbon
isotopes and the PBL dynamics, while
the rest (3.5%±) was contributed by isotopic disequilibrium
between respiration and photosynthesis. This disequilibrium
effect on d13C of CO2 dynamics in PBL,
moreover, was confined to the near surface layers (less than
350 m).
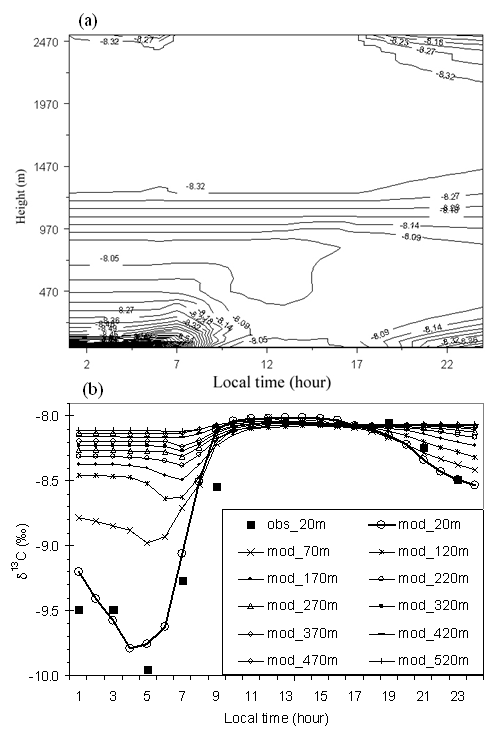
Figure 1. Time-height cross section
of simulated (multiple heights) and observed (20 m) diurnal
variations of d13C
of CO2 on June 4, 1999. (a) 2D contour
graph for d13C
(unit: ‰); (b) vertical profile of diurnal cycles of
d13C
(up to 520m, obs- campaign measured, mod- simulated)
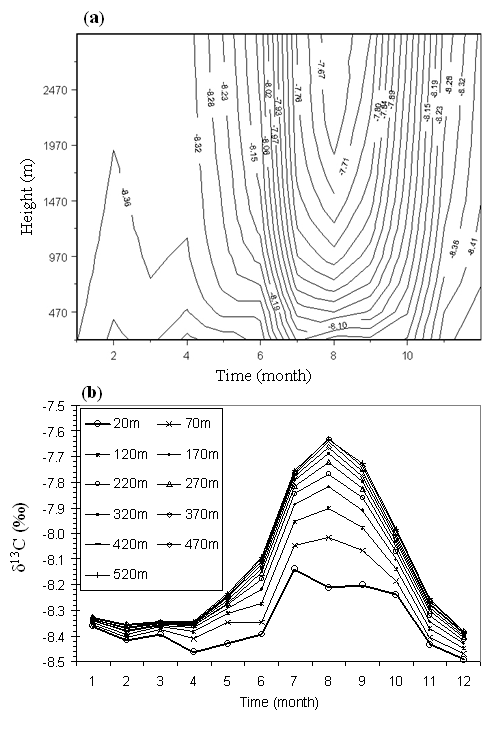
Figure 2. Time-height cross section
of simulated monthly mean d13C
of CO2 in 1999. (a) 2D contour graph
for d13C
(unit: ‰) up to 2500 m; (b) Simulated vertical profile
of monthly mean d13C
up to 520m
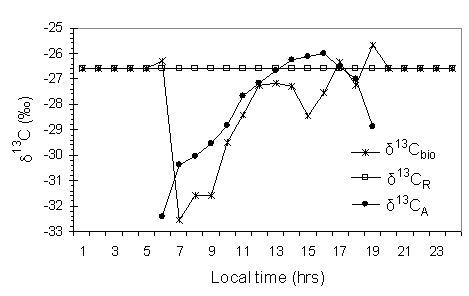
Figure 3. Comparison of monthly composite
diurnal variations in carbon isotopic signatures of net CO2
flux ( d13Cbio
), of gross primary production flux ( d13CA
), of ecosystem respiration flux ( d13CR
), for August of 1999 in a boreal ecosystem near Fraserdale,
Canada
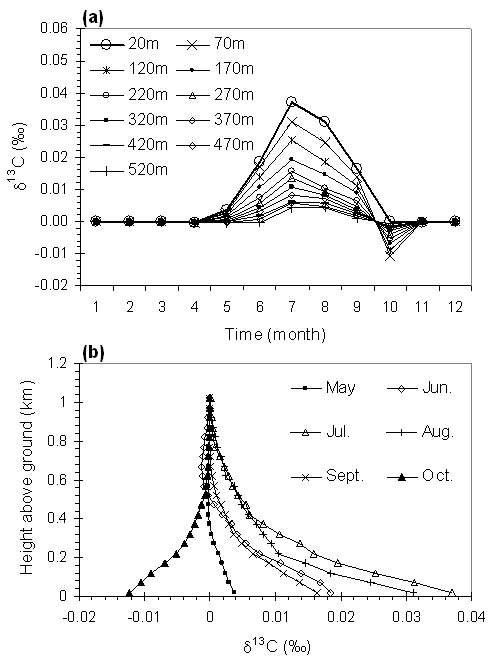
Figure 4. Differences in simulated
seasonal cycles of d13C
at different heights between with isotopic disequilibrium
(model 1) and without isotopic disequilibrium (model 2). (a)
differences in monthly mean d13C
at different heights (20 m up to 520 m) for1999; (b) vertical
profiles (up to 1.2km) of monthly mean difference for the
growing season of 1999
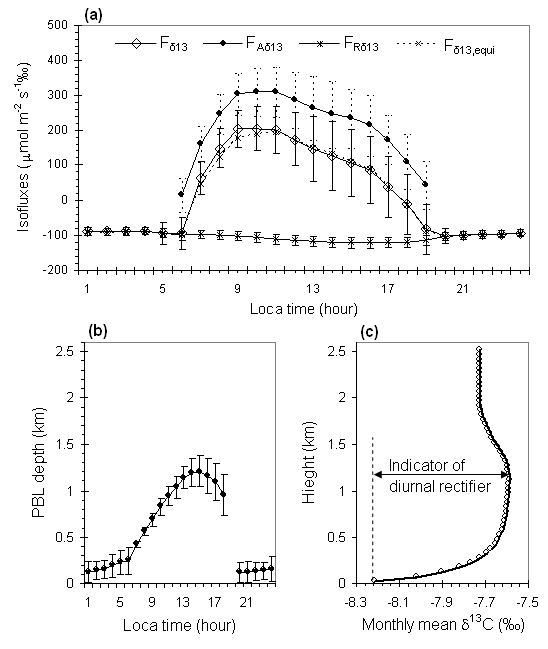
Figure 5. Schematic showing the mechanism
of the diurnal isotope rectification---an example from model
simulations of August 1999, over a boreal region near Fraserdale,
Ontario, Canada. (a) Simulated monthly composite diurnal isofluxes
of d13C
(Fd13,
FAd13,
and FRd13),
corresponding to net CO2 flux (Fnet
), net assimilation (FA ), and total
ecosystem respiration (FR ), respectively.
The "diagnostic" isoflux (Fd13,equi
) is also shown as comparison. (b) Simulated monthly composite
diurnal dynamics of the planetary boundary layer (Zi
). And (c) a simulated vertical profile of monthly mean d13C
of CO2. The error bars in panels (a)
and (b) indicate the standard deviation.
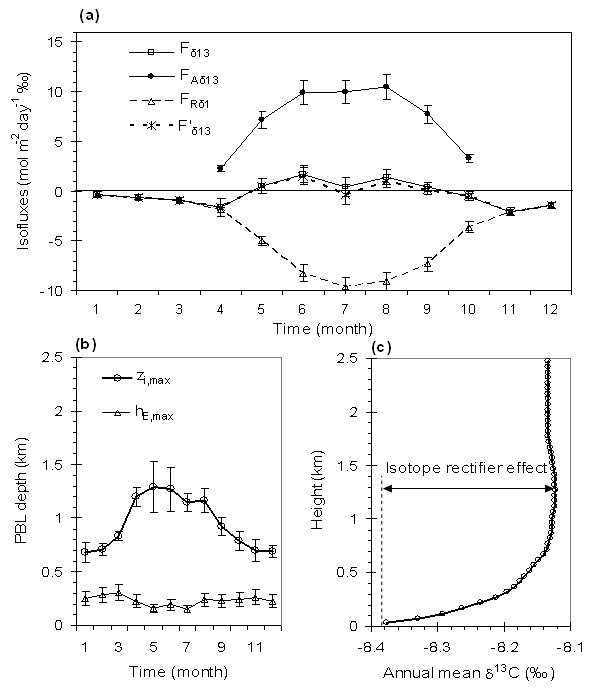
Figure 6. Schematic showing the mechanism
of the seasonal isotope rectification---an example from model
simulations for 1999, over a boreal region near Fraserdale,
Ontario, Canada. (a) Simulated seasonal variations in isofluxes
of d13C:
Fd13,
FAd13,
and FRd13,
corresponding to net CO2 flux (Fnet),
net assimilation (FA), and total ecosystem
respiration (FR), respectively. The
simulated monthly mean "diagnostic" isoflux is also shown
as comparison. (b) Simulated seasonal dynamics of the planetary
boundary layer: Zi,max and hE,max
are the monthly averages of daily maxima of the CBL depth
and of the equilibrium height of NBL, respectively. And (c)
a simulated vertical profile of annual mean d13C.
The error bars in panels (a) and (b) indicate the standard
deviation.
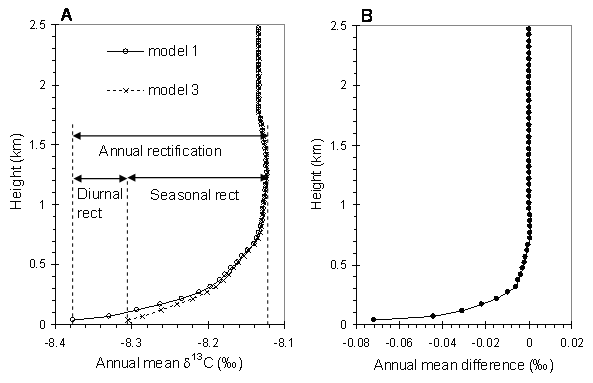
Figure 7. Annual, seasonal and diurnal
isotopic rectification. A: Comparison of vertical patterns
in annual mean d13C
of CO2 simulated by hourly (model 1)
and daily (model 3) isofluxes from the ground to 2.5 km in
1999; B: The effect of the diurnal cycle on the profile of
simulated d13C
(i.e. diurnal rectification), is seen as the difference between
the hourly and daily calculations. Annual total isotope rectification
(rect) is partitioned into diurnal and seasonal components
|